How Organizations Can Reduce the Economic Incentives of Vulnerabilities
In the last of our three-part series, Tenable Research evaluates the prevalence of vulnerabilities across the global population, as well as the implications of those findings on attackers' economic incentives.
This is the third and final installment of our blog series on persistent vulnerabilities and their causes. The new report from Tenable Research seeks answers to the following research questions:
- Do the characteristics of vulnerabilities affect their persistence? Or, is persistence merely related to the remediation process and its pace?
- Are there vulnerability remediation differences between organizations? And, are there differences within each organization?
Our previous articles detailed the methodology and key findings behind this research, as well as the lifespan of vulnerabilities within a given organization. In this post, we examine remediation trends across organizations to understand how vulnerabilities persist throughout the global asset population. We conclude with a reflection on how the security community can reduce attackers’ economic incentives by rooting out prevalent vulnerabilities.
Persistence 101: How to identify enduring vulnerabilities
The main objective of remediation is to minimize the exposure to vulnerabilities, especially the ones representing the highest risk. When a vulnerability is either lagging behind in remediation or has a low remediation rate overall (see Figure 1), we talk about persistence. Here, we focus on exploitable vulnerabilities and include a prevalence measure (i.e., To what degree must a vulnerability exist across the global user and asset population to make it a viable and attractive target for attackers?).
The level of risk that vulnerabilities pose to organizations fluctuates. The faster the assessment and remediation cycle within an organization, the better it can properly manage risk. Figure 1 shows the timelines associated with seven exploitable vulnerabilities.
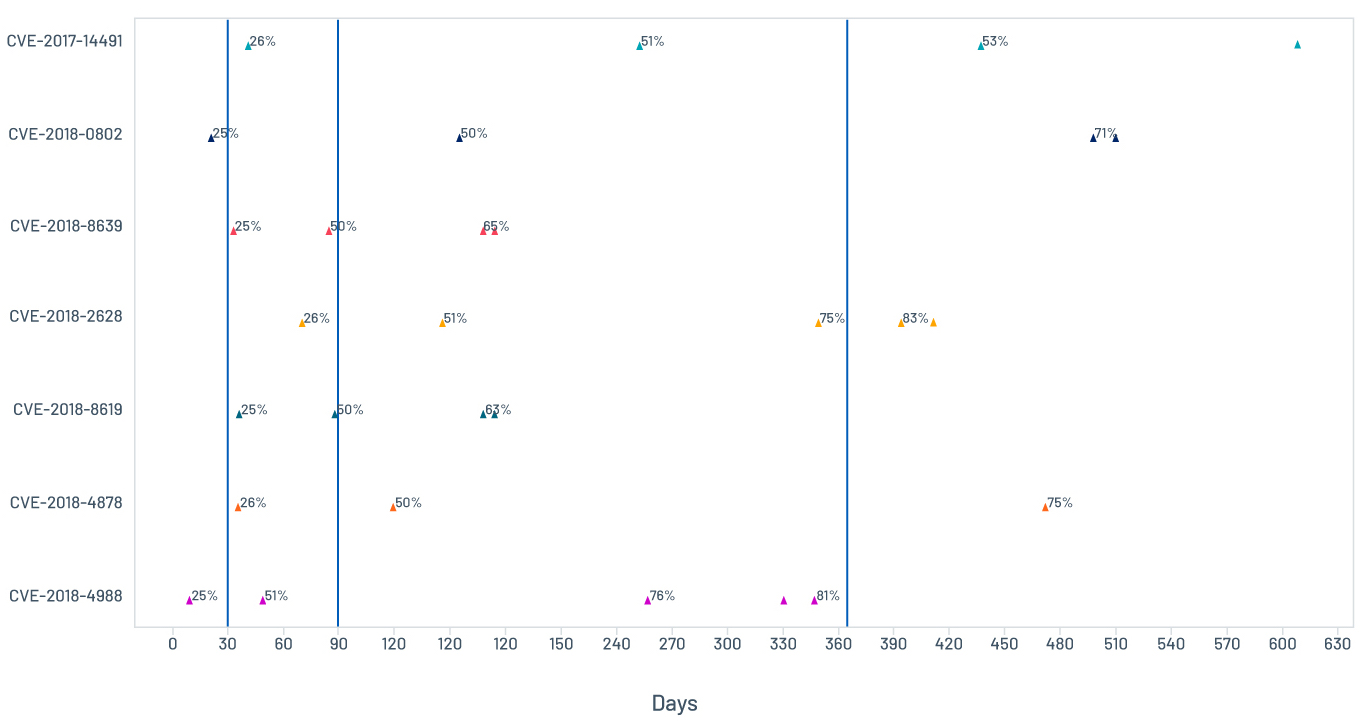
Figure 1. Example of individual vulnerabilities remediation timelines
We see Adobe CVE-2018-4988 has the fastest remediation pace and reached 81 percent remediation overall. We also clearly see an outlier in the Oracle WebLogic Server CVE-2018-2628, which consistently carries a delay in remediation over time. Another outlier is the dnsmasq heap buffer overflow CVE-2017-14491, which does not have a large delay initially, but only reaches 53 percent remediation after over a year. These two are considered persistent vulnerabilities.
High outliers indicate wide variance across organizations
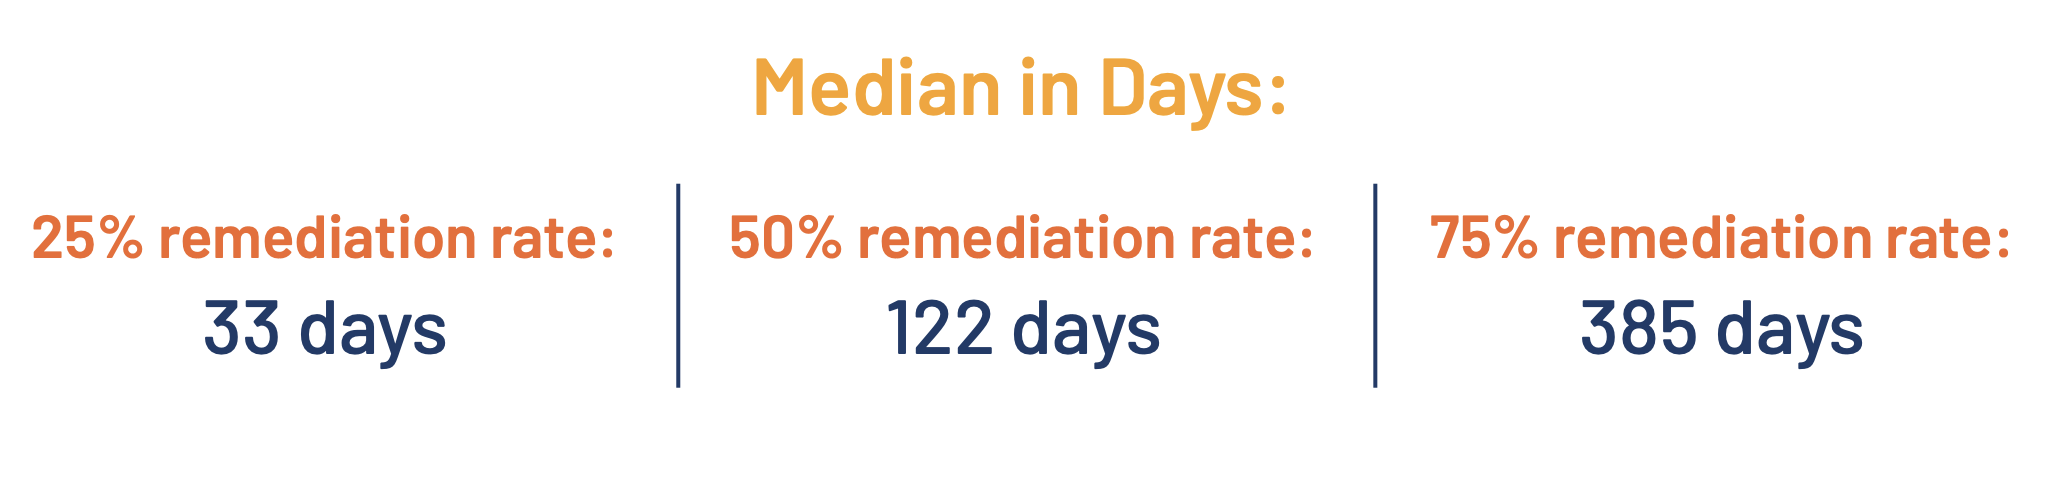
Figure 2 shows the distribution of remediation data. A large increase in variability over time points to a huge disparity in the remediation pace across organizations and the longtail difficulties of remediation. The dispersion grows at a phenomenal rate over time, as the median time to remediate 75 percent of instances of a vulnerability globally is higher than tenfold the median to reach 25 percent. It is also shown by the overlap in successive levels. Many vulnerabilities reach a 50-percent and even 75-percent overall remediation rate before others reach 25-percent. Let’s take a look at the outlier sets and their characteristics.
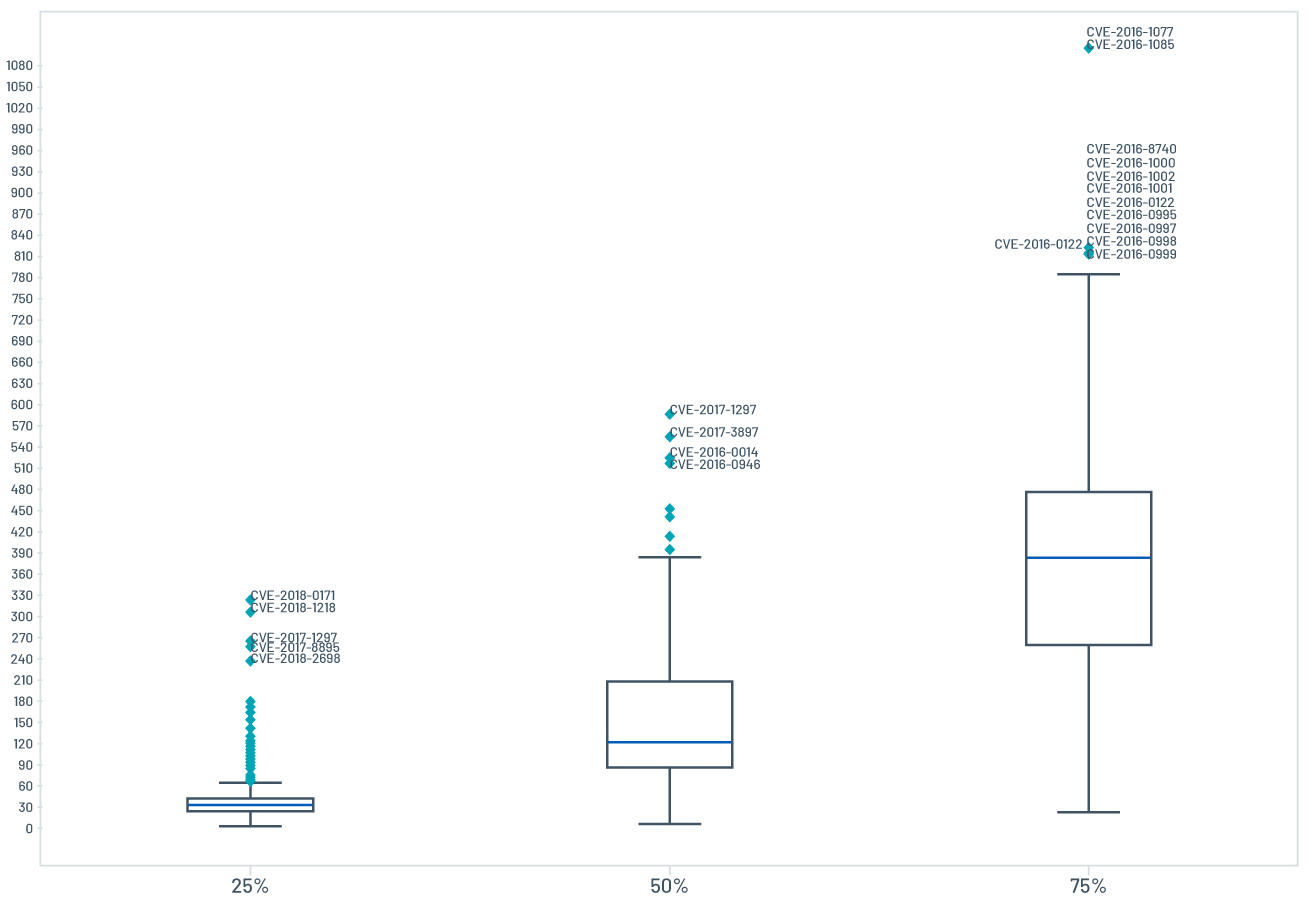
Figure 2. The distribution of remediation data
Client-side vulnerabilities are among the most persistent threats
Vulnerabilities in the outlier sets are mainly client-side vulnerabilities, as shown in Table 1.
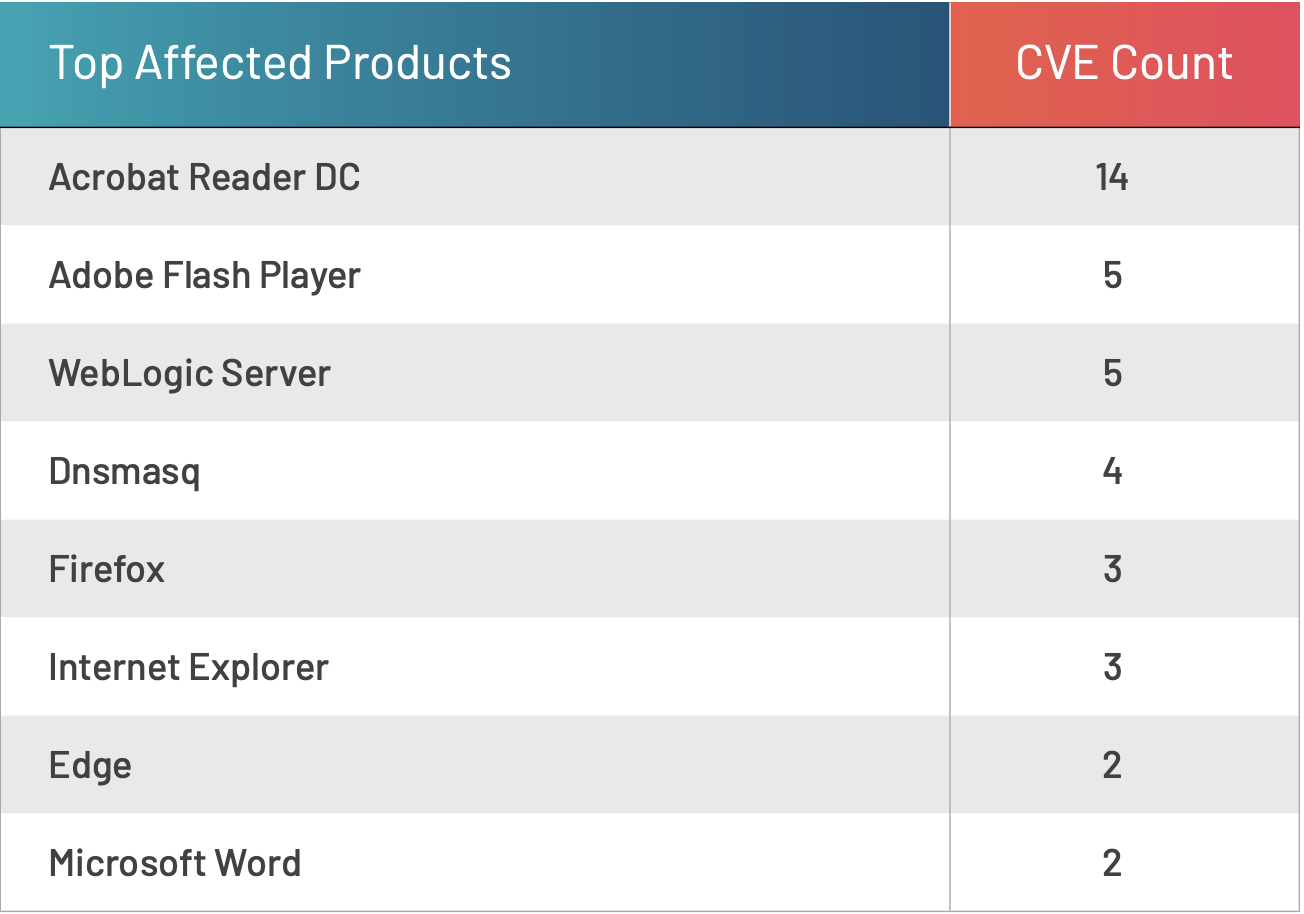
Table 1. List of top affected products in outlier sets
This suggests either a bias toward server-side vulnerabilities or user engagement difficulties. Given that most attacks on enterprise networks are the result of successful spear phishing or web attacks,1 this gap in managing client-side vulnerabilities must be closed.
Figure 3 shows the distribution of exploitability in the persistent set. Over 60 percent of the client-side persistent vulnerabilities were exploited in the wild.
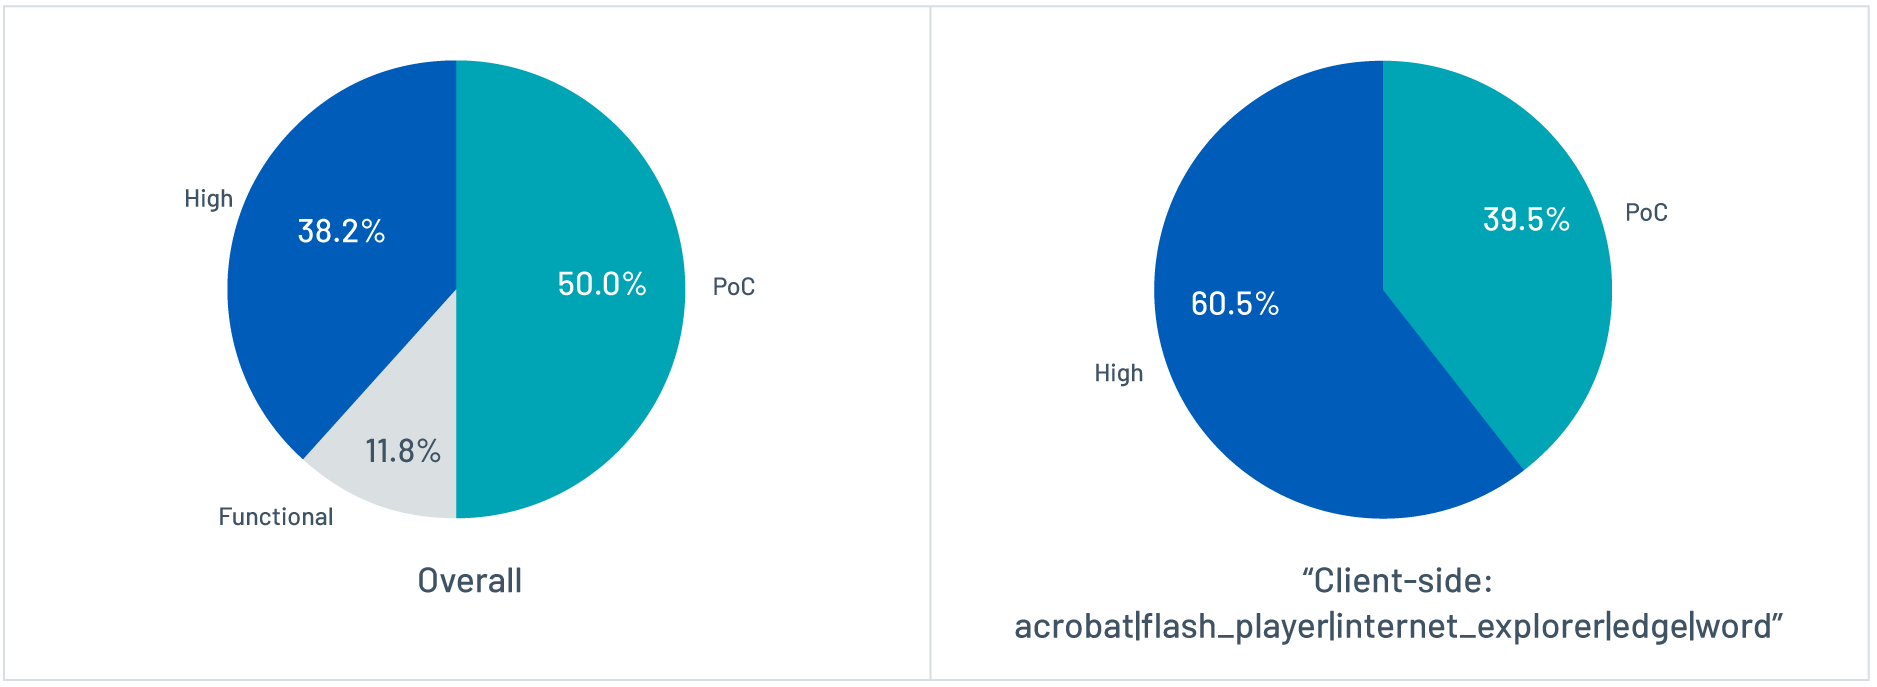
Figure 3. Distribution of exploitability
Oracle WebLogic constitutes another big source of outliers. The reason, in this case, might simply be the complexity involved in patching and upgrading WebLogic, which can be a lengthy process with varying requirements. But, it might also be related to the network setup, other countermeasures or the type of asset – for example, production assets may undergo systematic fixes while development assets remain unaddressed until the next major upgrade.
Characteristics of exploitable persistent vulnerabilities
Table 2 shows the main characteristics of the exploitable persistent set.
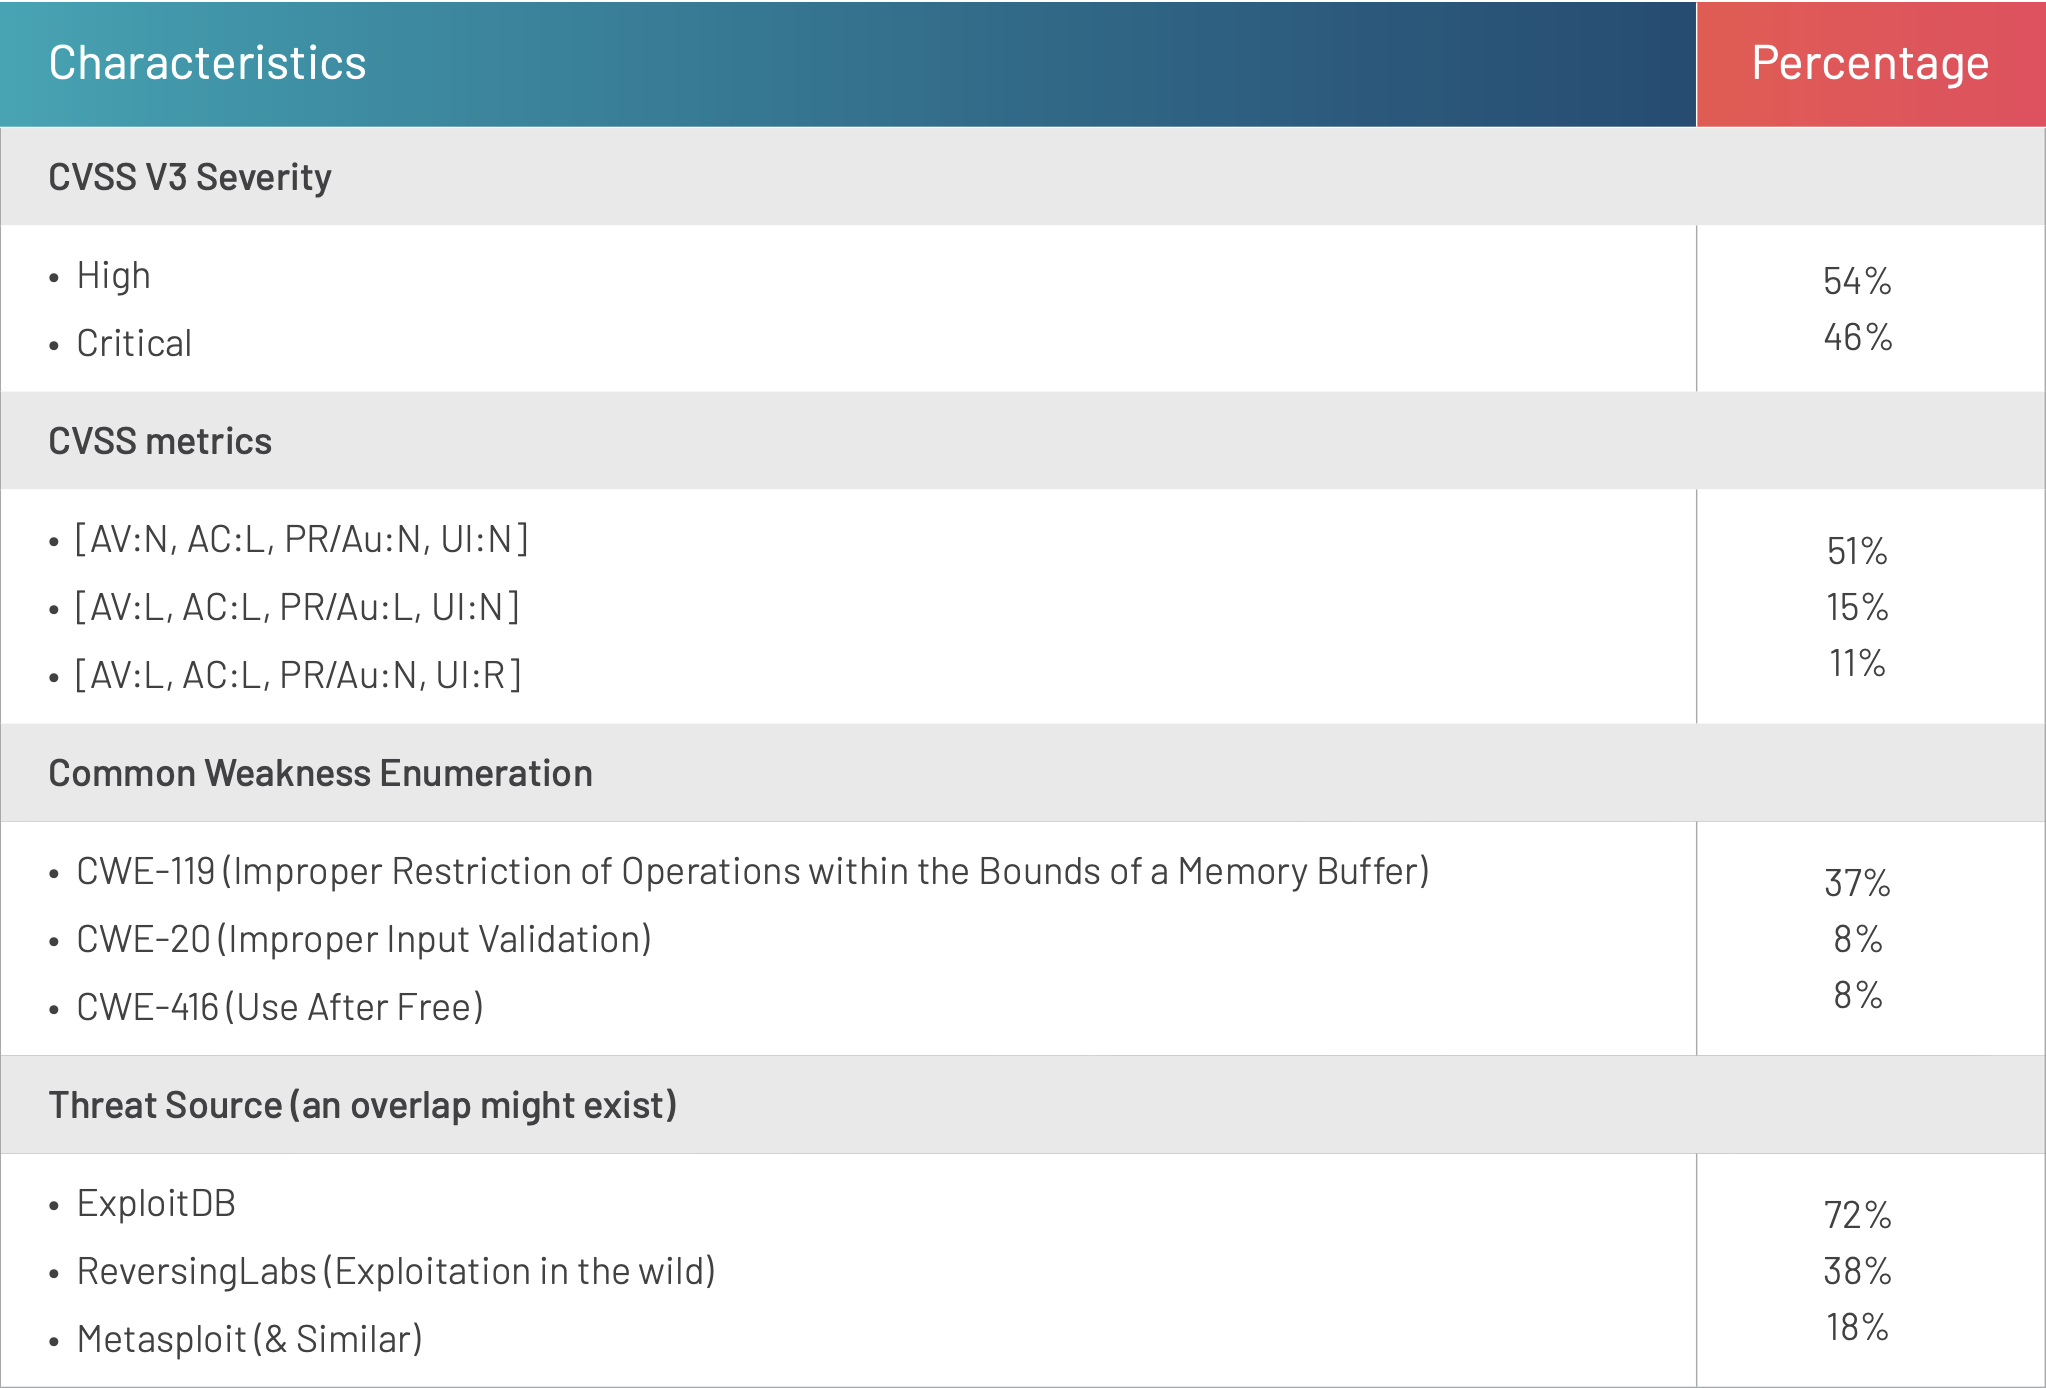
Table 2. High-level characteristics of the exploitable persistent set
The prevalence of high-severity, low-attack-complexity and exploited-in-the-wild vulnerabilities among this persistent set confirms issues in prioritization pointed out in part two of this series. That is, defenders are not dealing with higher-risk vulnerabilities faster than other vulnerabilities.
In reality, defenders haven’t had the proper tools to prioritize and monitor attackers’ actions and the threat landscape. On the other hand, issues in prioritization might also be a result of additional environmental and human factors hindering remediation performance. In the next section, we look at some of these additional aspects, including whether fast-remediating organizations fare any better with regard to highly prevalent persistent vulnerabilities. Figure 4 illustrates the overall prevalence of the persistent vulnerabilities in the data set.
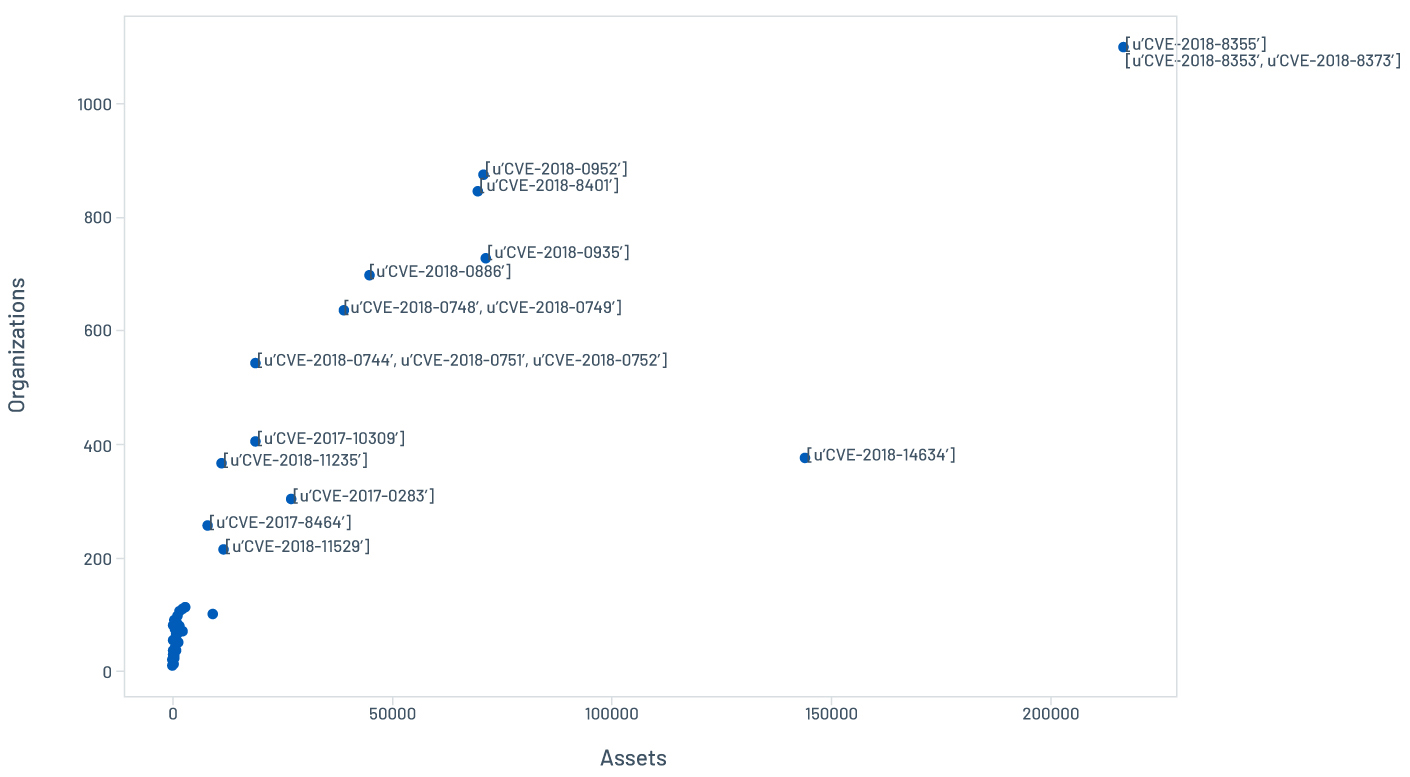
Figure 4. Overall prevalence of persistent vulnerabilities
Prevalent vulnerabilities affect even high-performing organizations
Most organizations are falling behind in the remediation race (i.e., not closing as many vulnerabilities as were opened in a given timeframe). We measured the pace in our sample by calculating the average number of open and closed vulnerabilities in the assessment and remediation windows for all vulnerabilities.
Results show that only 5.5 percent (Figure 5) of organizations have achieved a remediation rate higher than their assessment rate.
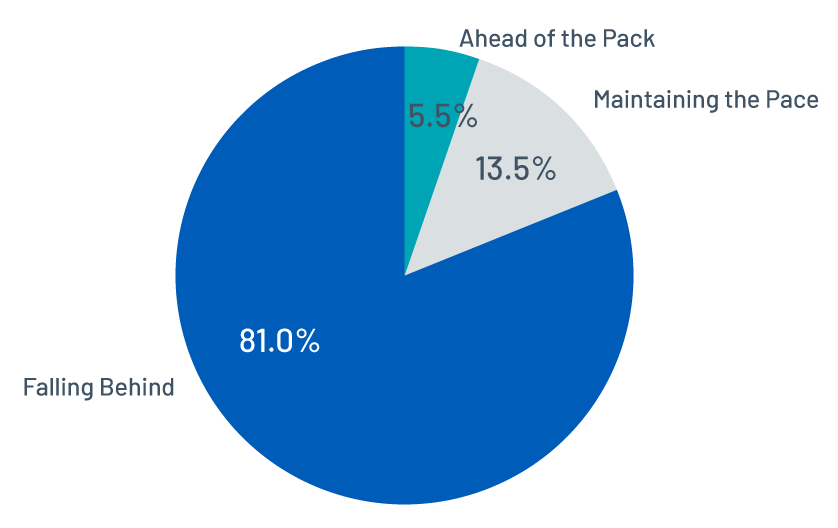
Figure 5. The distribution of remediation pace across organizations
The question we’re asking here is: What does the prevalence of persistent vulnerabilities look like across different pace profiles? Figure 6 shows most of the persistent vulnerabilities are still prevalent among the top performers, as compared to the overall data in Figure 4, indicating that higher remediation capacity and pace has little effect on those vulnerabilities’ persistence.
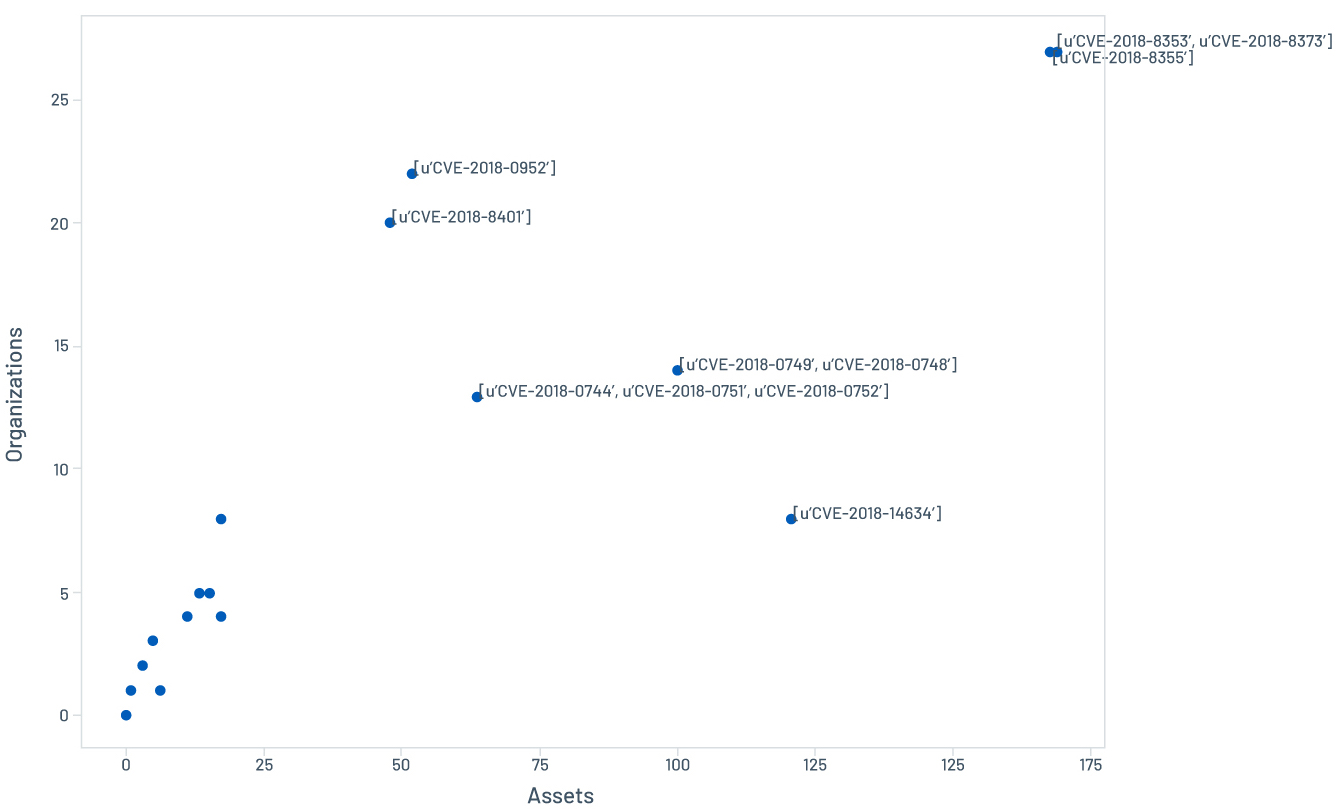
Figure 6. Prevalence of persistent vulnerabilities among top performers
This suggests a different answer to our first research question: while vulnerability characteristics are not related to localized persistence, they do play a role in cases of global persistence.
Larger software footprints likely mean greater persistence and prevalence
The most prevalent persistent vulnerabilities (CVE-2018-8353, CVE-2018-8355 and CVE-2018-8373) are a set of remote memory-corruption vulnerabilities, affecting multiple versions of Internet Explorer, which could allow remote attackers to execute arbitrary code. Exploitation in the wild of CVE-2018-8373, for instance, was spotted just a day after Microsoft’s July 2018 Patch Tuesday, long before its NVD publication date.
So, why is this vulnerability both persistent and prevalent across the board? It is most likely related to the list of CPEs or affected software configurations. The more operating systems and product versions the vulnerability affects, the harder it is to fix, leading to persistence.
As a matter of fact, the outlier set has an average of 14.8 CPEs, compared to an average of 8 CPEs in the top 100 most swiftly remediated vulnerabilities (i.e., within 20 days). A longer list of CPEs would also reflect a larger volume of assets in many cases, as shown in Figure 4 and 6, and consequently a higher difficulty to remediate comprehensively.
Economic incentives are key to an effective defense
Another key factor to consider when evaluating remediation behavior and priorities is whether the strategies in place reduce economic incentives for attackers. Attackers are economically driven; they seek to reduce cost and increase revenue by exploiting prevalent vulnerabilities. Studies have already suggested that attacker economic incentives should be considered for defensive strategies.2 3
One can argue that the prevalence of vulnerabilities is a much more interesting indicator of risk than the number of vulnerabilities present on a system. Attackers are slow to introduce new vulnerabilities into their toolkits and they tend to use existing vulnerabilities if there are enough vulnerable systems. Organizations might find it useful to think about the security of the whole community, and even rethink their own remediation behavior and priorities to reduce the economic appeal of vulnerabilities by reducing their prevalence. Increasing the costs and decreasing revenue may effectively deter the development and deployment of attacks.
Conclusion: Bringing prioritization into your remediation strategy
As we’ve discussed, our analysis shows that exploitable and higher-risk vulnerabilities are not remediated faster than any other vulnerability. To improve this, organizations need better prioritization methods that incorporate components like threat intelligence and asset criticality. The industry needs to step up and provide tools and resources for organizations to effectively reduce risk.
Data-driven insights are critical for determining the real risk that vulnerabilities present to an organization. Tenable has a 4.5-petabyte data lake of threat, vulnerability and asset information it analyzes to predict vulnerability priority, asset criticality and identify key maturity metrics to drive process improvement. Predictive Prioritization combines Tenable-collected vulnerability data with third-party vulnerability and threat data and analyzes them to identify the vulnerabilities with the highest likelihood of exploitation within the short term future.
By leveraging these kinds of tools, organizations can opt out of the remediation race and finally gain ground against cyberthreats, by focusing on the risks that matter most.
1. Symantec, "Internet Security Threat Report: Vol. 24," February 2019
2. P. Liu, W. Zang, "Incentive-Based Modeling and Inference of Attacker Intent, Objectives, and Strategies," Academic Paper, 2005
3. L. Allodi, F. Massacci, J. Williams, "The Work-Averse Cyber Attacker Model: Theory and Evidence From Two Million Attack Signatures," Academic Paper, 2017

Lamine Aouad
Principal Research Engineer, Tenable
Lamine Aouad is a principal researcher at Tenable. A former Marie Curie research fellow, Lamine previously worked as a researcher and lead data scientist at Symantec. He has a multidisciplinary background and has worked on multiple projects — in both academia and industry — involving data science, IT security and distributed computing and systems. Lamine holds a Ph.D. in computer science and has been published in over 30 peer-reviewed journals and conferences. He also very much enjoys long-distance hikes and mountaineering.
Related articles
The Buy Vs. Build Dilemma: Pitfalls of the DIY Approach to Exposure Management
Some security teams are taking a do-it-yourself approach to exposure management, according to a recent study conducted by Enterprise Strategy Group, now part of Omdia, in partnership with Tenable. But are they really ready for the hidden costs and challenges that come with a homegrown system?

How to Future-Proof Your Cybersecurity Spend
A recent study conducted by Enterprise Strategy Group, now part of Omdia, in partnership with Tenable reveals that complexity is driving a growing number of organizations to increase their exposure management budgets. Here are 5 considerations to help make the most of your investments.
Security Leaders are Rethinking Their Cyber Risk Strategies, New Research from Tenable and Enterprise Strategy Group Shows
Get a firsthand look at how 400 security and IT leaders are tackling today’s cyber risk challenges in this latest study from Tenable and Enterprise Strategy Group.
- Research Reports
- Vulnerability Management