by Josef Weiss
Databases can potentially store valuable data for an organization that may not have daily database activity monitoring mechanisms in place. Many organizations involved in retail, financial, healthcare, and other industries benefit from the utilization of databases to store customer, financial, or healthcare information. Regulations such as PCI, SOX, and HIPAA have stringent compliancy requirements to safeguard this personal information of customers.
With the increased use and prevalence of databases, database management system attacks have also increased. Because of the wealth of information that is available, databases typically have a high rate of breaches among all business assets. Many times attackers take advantage of exploits or previously known vulnerabilities to gain access. Breaches and loss of data can be costly, both financially and in terms of reputation for an organization.
The Database Detection and Analysis dashboard contains components to assist in the identification of database management systems and associated vulnerabilities. Analysts are provided with vulnerability data within this dashboard, which can be easily used to assist in reducing database vulnerabilities. Components assist analysts by identifying database management systems, database events, and providing database management system specific vulnerability summaries.
The dashboard and its components are available in the Security Center Feed, a comprehensive collection of dashboards, reports, Assurance Report Cards, and assets. The dashboard can be easily located in the Security Center Feed under the category Monitoring.
The dashboard requirements are:
- Tenable.sc 5.0.0
- Nessus 8.6.0
- NNM 5.9.0
Security Center provides continuous network monitoring, vulnerability identification, risk reduction, and compliance monitoring. Security Center is continuously updated with information about advanced threats, zero-day vulnerabilities, and new types of regulatory compliance configuration audits. Security Center allows for the most comprehensive and integrated view of network health.
The dashboard contains the following components:
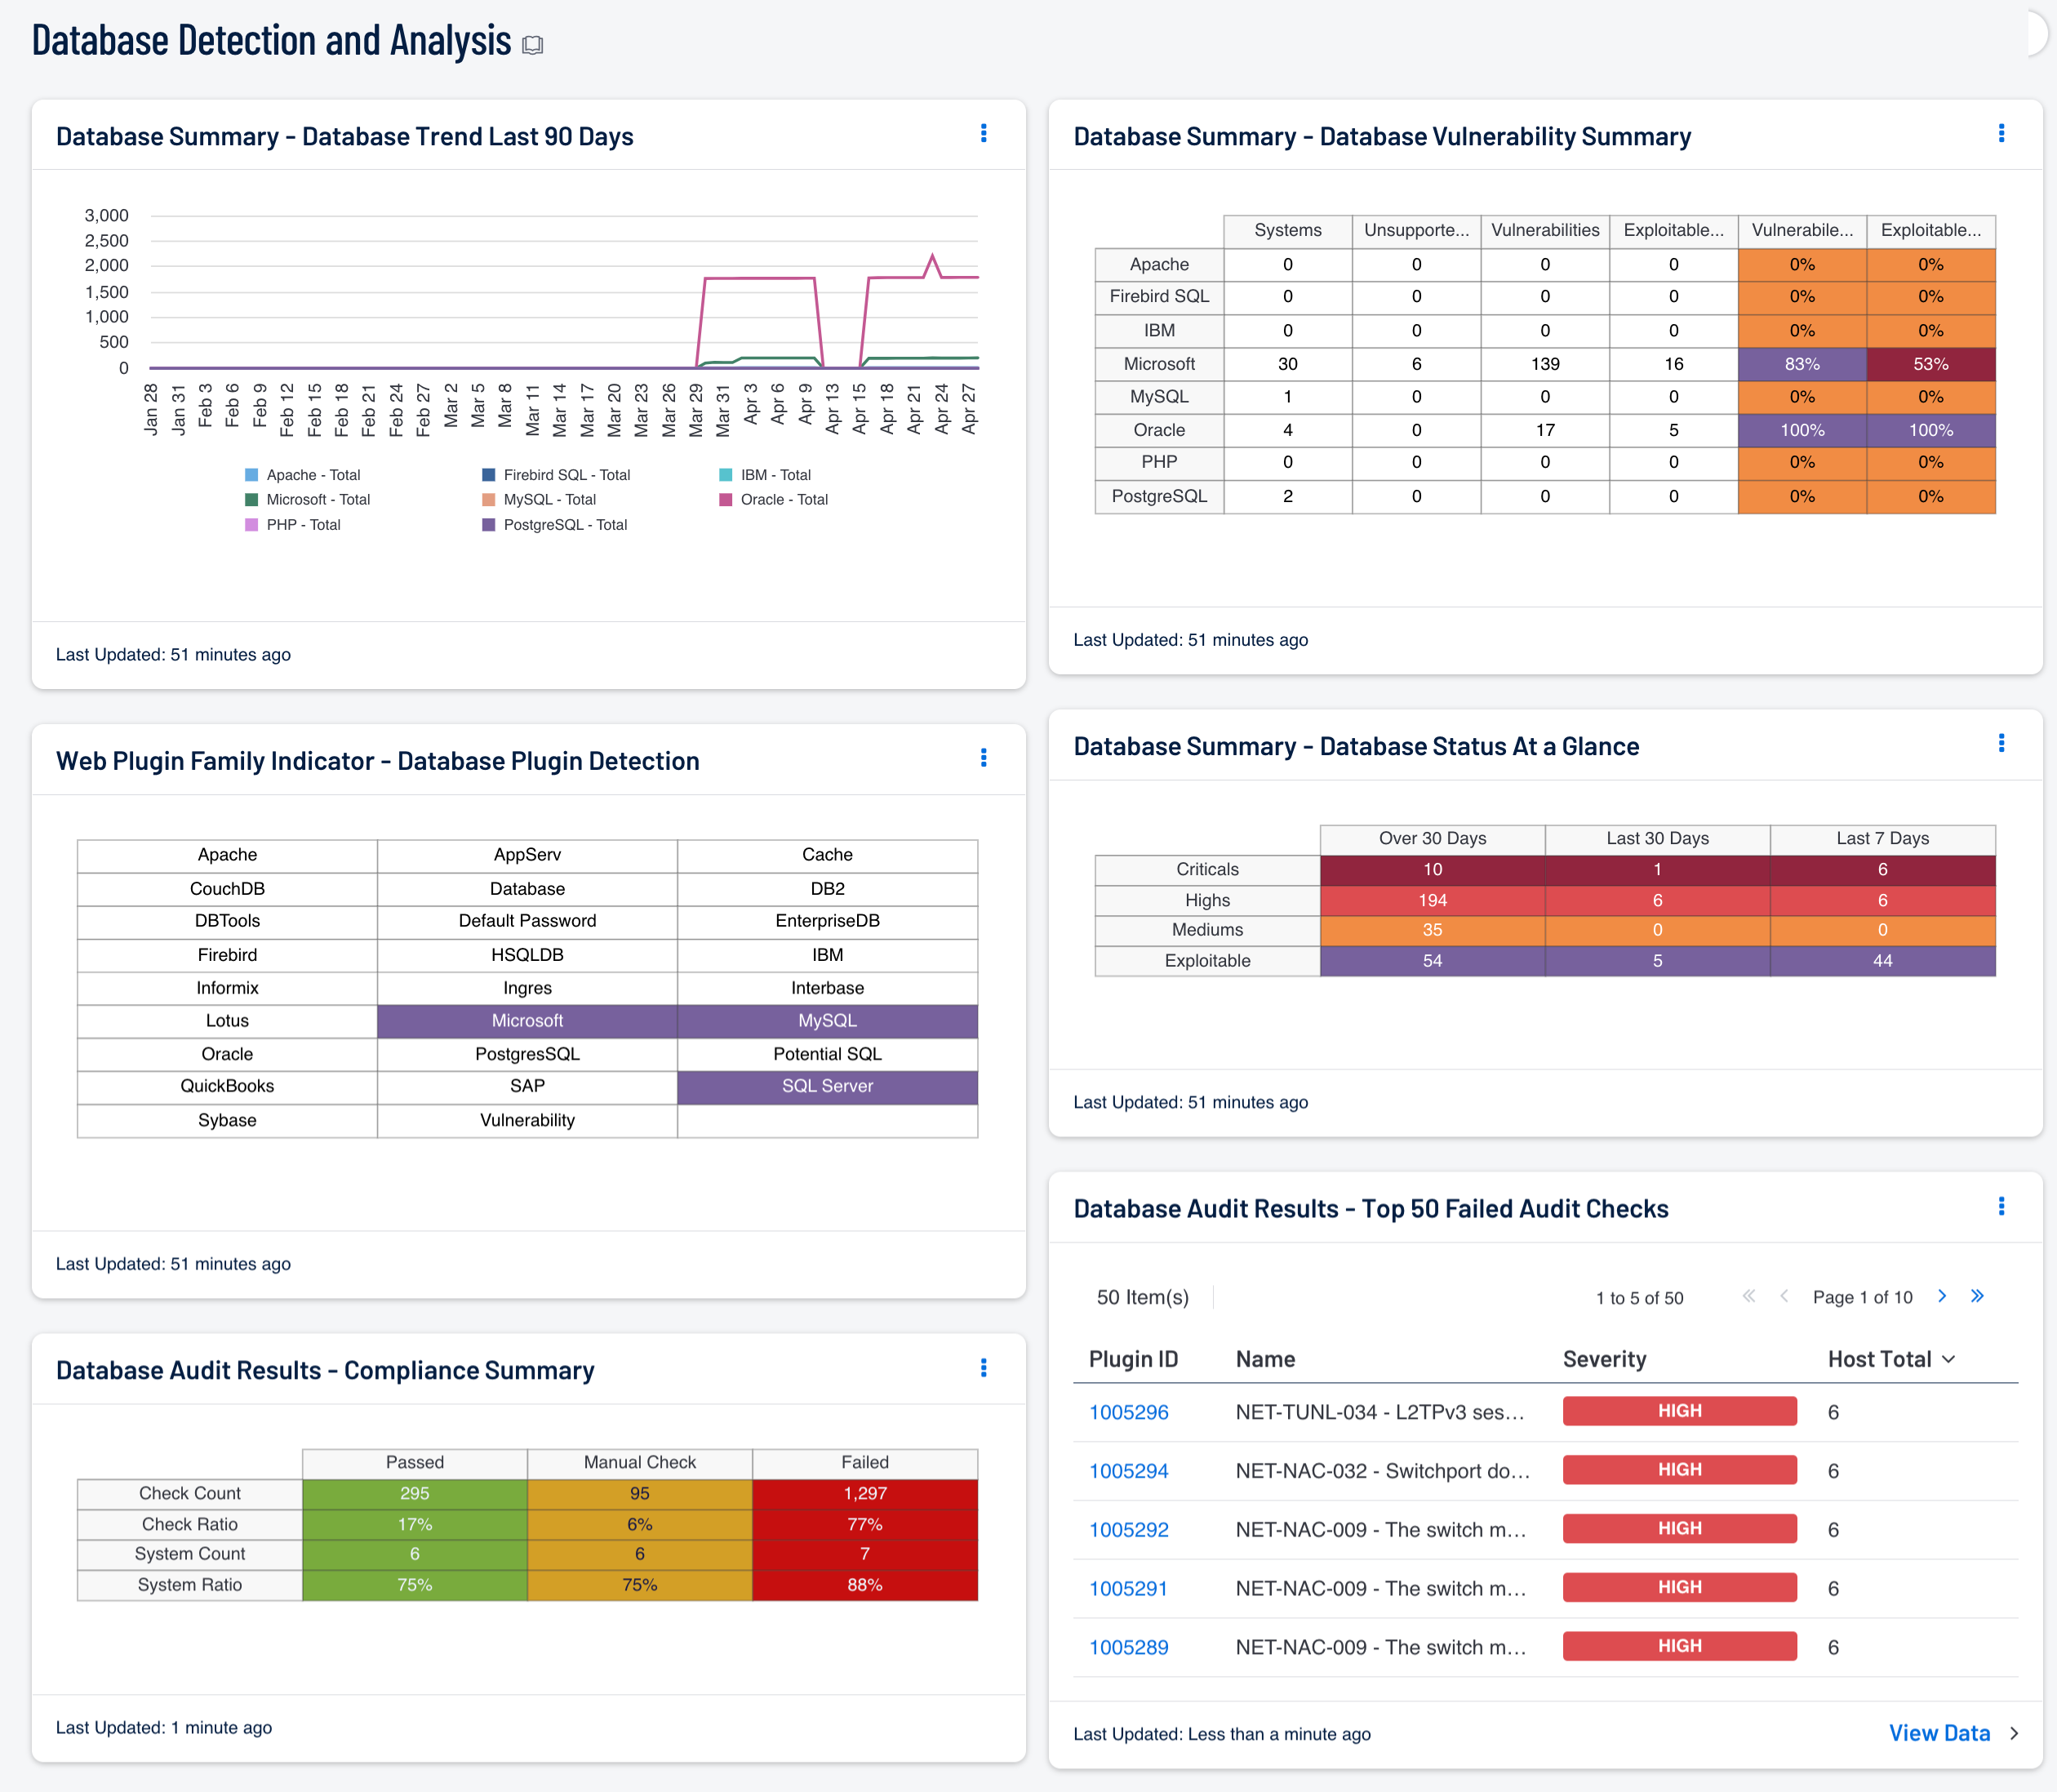
- Web Plugin Family Indicator – Database Plugin Detection: Database services in an organization are commonly set up for a very specific purpose. Analysts should be aware of database services that may be operating in the organization. This component contains indicators that turn purple when the particular database service is detected in the organization. This component lists software from major vendors, free services, and more in this component.
- Database Summary – Database Status At a Glance: This component gives a quick visual status report on patching efforts. The number of critical, high, and medium vulnerabilities is displayed across three columns, as well as the number of days they have been detected. Represented are known vulnerabilities that have existed for Over 30 Days, the Last 30 Days, or the Last 7 Days.
- Database Summary – Database Vulnerability Summary: This component displays various defined technologies by row, and enumerates any found vulnerabilities across the columns. Presented is the number of systems on which the technology has been located, the number of identified vulnerabilities, the ratio of vulnerable systems, and the count of how many are exploitable.
- Database Summary – Database Trend Last 90 Days: This component tracks a trend of the number of vulnerabilities by installed application over the last 90 days.
- Database Audit Results - Compliance Summary: When performing configuration audit of systems in accordance with a GRC program, security analysts can benefit from a summary view of the data set. The Database Compliance Summary table provides a high-level view of the Database compliance status. The first two rows provide the total count of Passed checks, Failed checks, and checks requiring a manual review. The first row, 'Check Count', provides a count of the current checks per check status. The second row, 'Check Ratio', provides a ratio view of check status. The three columns together should total 100%.
- Database Audit Results - Top 50 Failed Audit Checks: The Database Top 50 Failed Audit Host Details table is an informative table providing the most common audit checks that have failed the compliance check. Audit checks that have failed the compliance check are out of the compliance range. For example, if the audit check is for password length and the expected range is 8 - 15 characters, and policy is set to 16 - 25, the check would fail even though the policy is more strict than the audit check.
Tenable One
Request a demo
The world’s leading AI-powered exposure management platform.
Thank You
Thank you for your interest in Tenable One.
A representative will be in touch soon.
Form ID: 7469
Form Name: one-eval
Form Class: c-form form-panel__global-form c-form--mkto js-mkto-no-css js-form-hanging-label c-form--hide-comments
Form Wrapper ID: one-eval-form-wrapper
Confirmation Class: one-eval-confirmform-modal
Simulate Success