Narrowing the Focus: Enhancements to Tenable VPR and How It Compares to Other Prioritization Models
Tenable is releasing a number of enhancements to the Vulnerability Priority Rating (VPR), including enriched threat intelligence, AI-driven insights and explainability, and contextual metadata. Learn how the improved prioritization effectiveness of the enhanced VPR compares to other common prioritization strategies.
Introduction
Effective vulnerability prioritization requires a combination of coverage and efficiency in reducing the sheer number of findings that security and IT teams need to act upon. In this blog, we explore common strategies used by security teams to prioritize vulnerabilities for remediation and discuss how they compare in terms of identifying those findings that present the greatest potential threat to an organization.
Tenable released and patented the original version of the Vulnerability Priority Rating (VPR) in 2019 to empower security teams to more effectively prioritize vulnerabilities for remediation efforts. Now, in 2025, we're releasing enhancements to VPR, making it twice as efficient as the original version at identifying CVEs that are currently being exploited in the wild or are likely to be exploited in the near term.
The vulnerability prioritization problem
Vulnerability prioritization has challenged security teams for many years, exacerbated by the constant publication of ever-increasing numbers of software vulnerabilities.
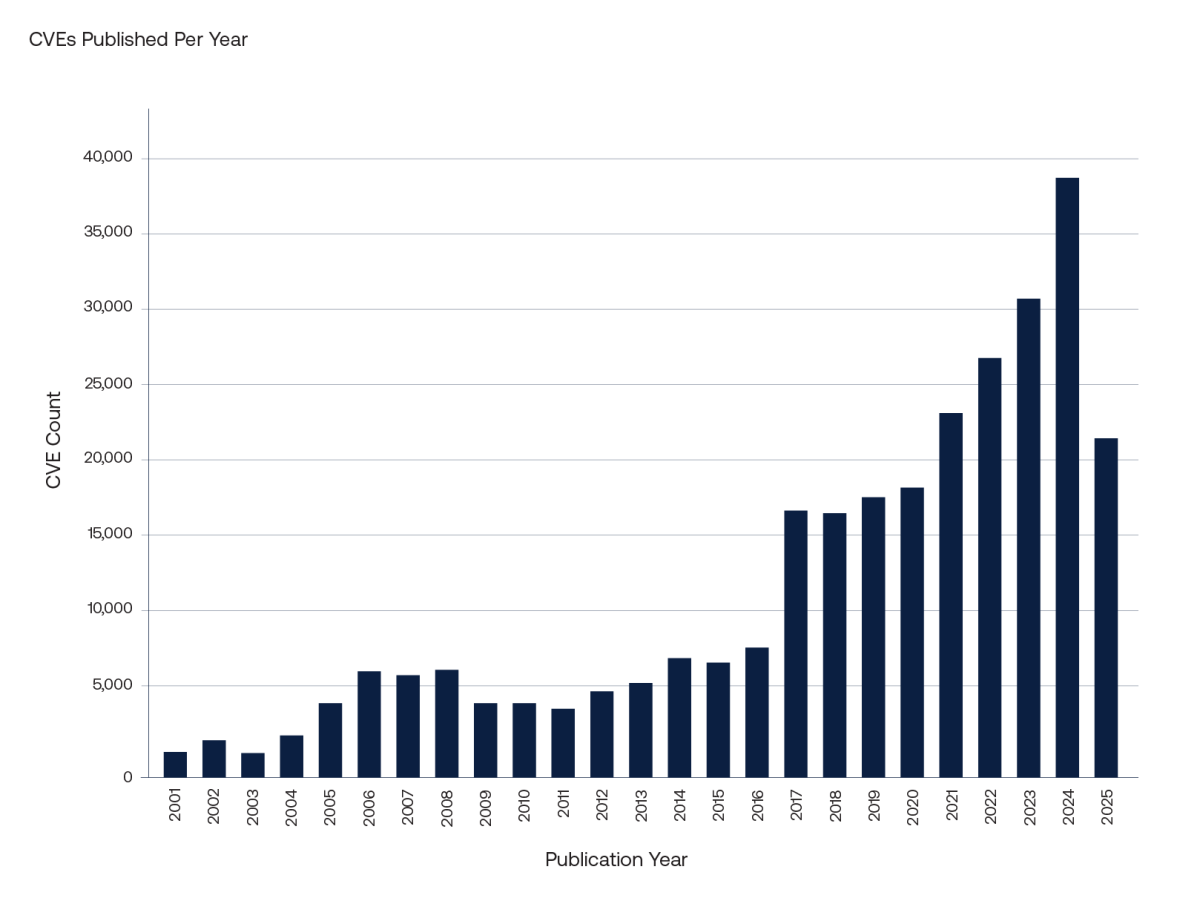
The bar chart above shows the number of Common Vulnerabilities and Exposures (CVEs) published per year. This number has been steadily increasing and has significantly accelerated since 2022. At the time of this blog’s publication, over 20,000 new vulnerabilities have been published to the National Vulnerability Database (NVD) since the start of 2025.
Tenable has long recognized the critical need for effective vulnerability prioritization, and VPR has consistently provided security teams with precise, actionable insights to address this challenge. VPR is available in the following Tenable products:
- Tenable Vulnerability Management
- Tenable Security Center
- Tenable Web App Scanning
- Tenable OT Security
- Tenable Cloud Security
- Tenable One
While VPR has been an integral component of Tenable’s vulnerability management solutions since its release, the ever-evolving threat landscape and the sheer volume of new vulnerabilities necessitate continuous innovation. We’re excited to introduce you to recent enhancements to VPR in Tenable Vulnerability Management that are a direct response to the accelerated growth in disclosed vulnerabilities, aiming to further refine our prioritization capabilities and empower organizations to focus on the threats that matter most, with even greater accuracy and efficiency.
Enhancements to the VPR scoring model
The enhanced VPR scoring algorithm consists of two key components:
- The Common Vulnerabilities Scoring System (CVSS) impact score
- A threat score based on the likelihood of near-term exploitation activity in the wild
A Random Forest classification model is used to predict the likelihood of near-term exploitation activity based on feature data collected over the previous 180 days.
A diversity of data sources are used to derive these model features.
- The Tenable Research team provides expert data such as: whether a CVE has been recently exploited in the wild; if the CVE is a zero-day; or if it has been exploited by malware. These tags are based on trusted news articles read by our security researchers.
- Generative AI is leveraged to process a curated list of news articles at scale and provide similar information plus other details such as threat actors targeting the CVE.
- Malware submission data is obtained from threat intelligence feeds, while other CVE metadata is obtained from the NVD and the Cybersecurity and Infrastructure Security Agency (CISA).
The exploit likelihood that is output from the Machine Learning model is mapped to a threat score in the range 0-5 and combined with the CVSS impact score to arrive at the VPR. The score is in the range 0-10, analogous to the CVSS base score.
VPR = (Impact Score/ 6)*5 + Threat ScoreThe VPR severity is classified as Low (0-4), Medium (4-7), High (7-9) or Critical (9-10), analogous to CVSS severity. The Tenable Research team also monitors the VPR scores and has the ability to upgrade or downgrade any that they consider anomalous.
For more detailed information on the VPR model, please refer to our publicly available technical white paper.
Prioritization strategies
The following are some of the most common strategies used by security teams to prioritize vulnerabilities.
CVSSv3 Severity
The aforementioned CVSS severity is one of the most widely used prioritization strategies. However, it suffers from the problem that too many CVEs are classified as having High or Critical severity. This leads to the situation that too many CVEs are prioritized for remediation and it is impossible for teams to tell which ones matter most or where to start without leveraging additional data.
EPSS
The Exploit Prediction Scoring System (EPSS) pursues a similar goal to the VPR threat model in that it seeks to identify those CVEs most likely to be exploited in the wild. The output of the model is a probability of exploitation. In the white paper “Enhancing Vulnerability Prioritization: Data-Driven Exploit Predictions with Community-Driven Insights,” EPSS researchers present the optimized decision threshold of 0.36 for determining which CVEs should be remediated. This threshold is what is used in our analysis below to determine which CVEs are prioritized and hence assess performance. The user is free to choose a decision boundary of their own so this is not the only possibility.
CISA KEV
CISA maintains a list of Known Exploited Vulnerabilities (KEV). A possible prioritization strategy would be to remediate anything that appears on this list first. While everything on this list is known to be exploited, it can take time for CVEs to be added to this list, potentially giving attackers a window of time in which exploited CVEs may fly under the radar. CISA KEV is also scoped specifically to products that are used by organizations under the purview of CISA. It does not cover all products.
Tenable VPR
The original version of VPR provides a drastically reduced set of CVEs to focus on in comparison to CVSS. It also provides some contextual information to explain the score. The enhancements to VPR further reduce the size of the set of prioritized CVEs without any loss in coverage of those CVEs that are exploited in the wild. The enhanced version of VPR also provides substantially more contextual information, which is covered in our technical white paper.
The enhanced version makes the model probability of exploitation (threat probability) available to the end user. This opens the door to another prioritization strategy based purely on thresholding the threat probability in a similar way to EPSS. Such a strategy does not take into account the CVSS impact score in the same way as the VPR score does, so it may not be appropriate for some security teams. The optimized decision boundary that balances false negatives and false positives is 0.23, where every CVE with a threat probability greater than this threshold is prioritized for remediation. The performance of this threshold, referred to below as Enhanced VPR Threat Probability (A) and another threshold (Enhanced VPR Threat Probability (B)) are assessed below.
How common vulnerability prioritization strategies perform
There are two types of error that a vulnerability prioritization strategy can make:
- False negatives — failing to prioritize a CVE that is subsequently associated with near-term exploit activity
- False positives — prioritizing a CVE that is not subsequently associated with near-term exploit activity
The following metrics are used to assess how each of the common prioritization strategies perform with respect to the errors described above:
- Coverage: The percentage of CVEs that were found to be associated with exploitation activity in the subsequent 28-day window that were correctly prioritized by the remediation strategy
- Efficiency: The percentage of CVEs prioritized by the given remediation strategy that were found to be associated with exploitation activity in the subsequent 28-day window.
There is usually a tradeoff relationship between coverage and efficiency. To reduce the number of false negatives (increased coverage) more CVEs will likely need to be prioritized, which generally leads to more false positives (reduced efficiency), and vice-versa. Security teams often prioritize high coverage over efficiency in an effort to minimize the attack surface and reduce the likelihood of a successful breach. However, this comes at the cost of expending more resources or time on less critical vulnerabilities, resulting in wasted effort. So, it's important that the workload itself (i.e. number of vulnerabilities flagged as High or Critical) is reduced so that teams can work efficiently.
How common vulnerability prioritization strategies compare against observed exploitation
To assess the predictive performance of each of the prioritization strategies defined above, the respective scores were recorded by Tenable Data Science on March 24, 2025. Based on these scores, it was determined which CVEs would be prioritized for remediation under each strategy. While there is no way to truly know which CVEs are actively exploited in the wild at any time, we can approximate it based on some indicators. CVEs were determined to be actively exploited in the wild based on one or more of the following criteria:
- if they were publicly reported as exploited during the window;
- if they were added to CISA KEV in the window; or
- if we observed malware submissions using the CVE during the window.
In total, 648 CVEs were found to be actively exploited in the wild during the 28-day window following March 24, 2025.
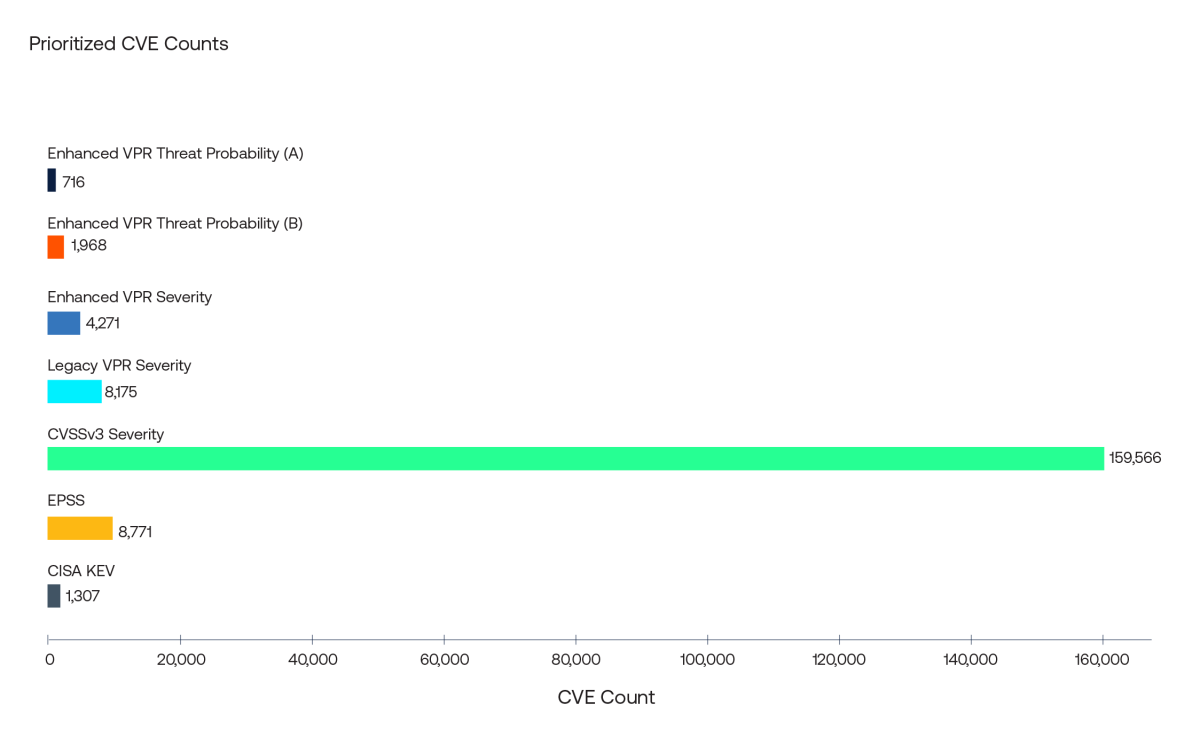
The bar chart below shows the number of CVEs prioritized by each of the common prioritization strategies described above. The CVSSv3 Severity, Enhanced VPR Severity and Legacy VPR Severity strategies all prioritize CVEs that have High or Critical severity under each metric, respectively. You can immediately see the problem with CVSSv3 Severity: far too many CVEs are prioritized. The two enhanced VPR threat probability strategies are included: Enhanced VPR Threat Probability (A) uses the optimized threshold of 0.23 and Enhanced VPR Threat Probability (B) uses an alternative threshold of 0.02. The first facilitates a fair comparison between the enhanced VPR threat probability and EPSS, as EPSS is assessed using its optimized threshold of 0.36. The second threshold prioritizes coverage over efficiency by lowering the decision boundary to 0.02.
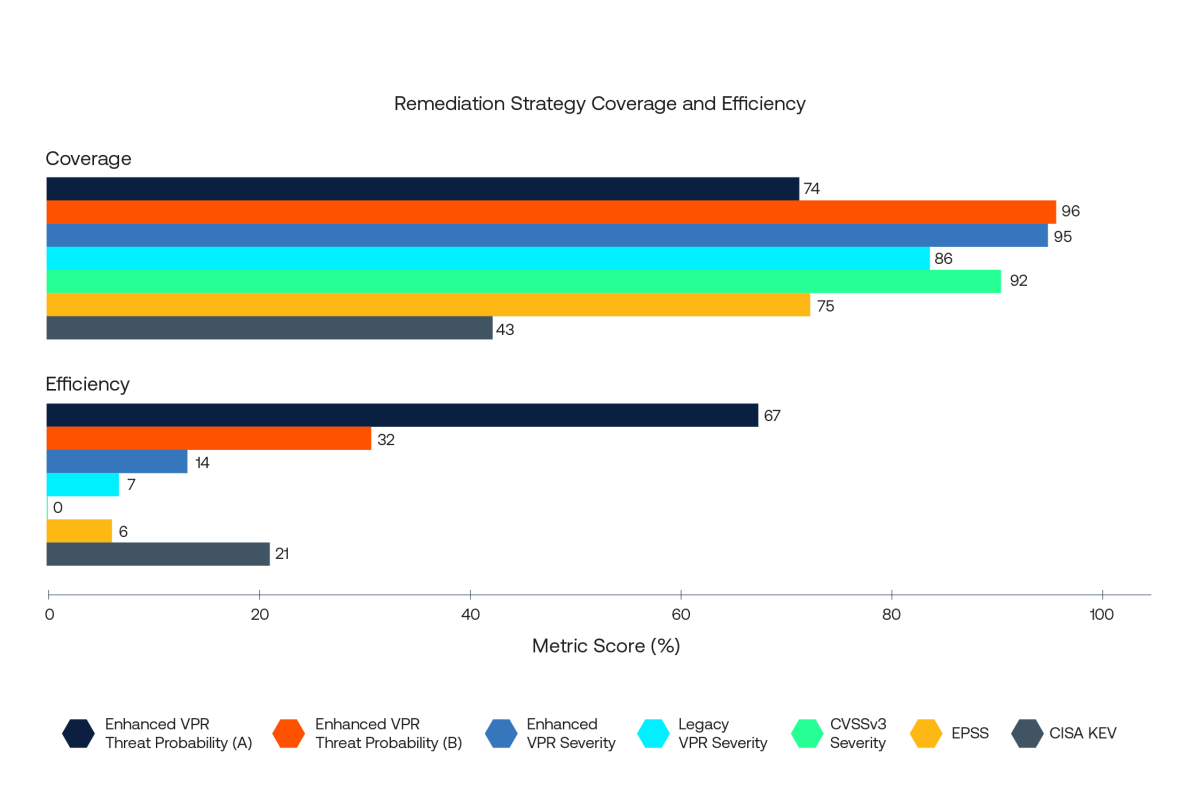
The coverage and efficiency metrics for each of these strategies is given in the following bar chart.
It can be seen that Enhanced VPR Threat Probability (B), Enhanced VPR Severity, Legacy VPR Severity and CVSSv3 Severity all score very highly in terms of coverage. These four strategies correctly prioritized between 560 and 620 of the 648 CVEs associated with exploit activity. The crucial difference is in the total number of CVEs that each strategy prioritized. To achieve its high coverage, CVSSv3 Severity prioritized almost 160,000 CVEs, an impossibly large workload for security teams, which is reflected in its approximately 0% efficiency statistic.
In contrast, Enhanced VPR Severity has a comparable coverage score to CVSSv3 Severity, but prioritized approximately 4,000 CVEs (14% efficiency). That is a monumental jump in efficiency. Enhanced VPR Threat Probability (B) has marginally higher coverage score at 96% and it prioritized less than 2,000 CVEs, resulting in 32% efficiency. (As previously noted, the two VPR threat probability strategies do not take the CVSS v3 impact score into account.)
Comparing the Enhanced VPR Threat Probability (A) strategy to EPSS (both strategies use the respective optimized decision boundaries) it can be seen that enhanced VPR Threat Probability (A) performs comparably to EPSS on coverage (74% vs 75%) but outperforms EPSS on efficiency (67% vs 6%). Enhanced VPR Threat Probability (A) and EPSS correctly identified 479 and 483 of the 648 CVEs associated with exploit activity, respectively. However, the total number of CVEs prioritized by the Enhanced VPR Threat Probability (A) strategy is just 716 compared to almost 8,800 for EPSS. Finally, only prioritizing those CVEs on CISA KEV catches just 276 of the 648 exploited CVEs (43% coverage) but efficiency is relatively high at 21%.
In comparison to the coverage provided by other popular prioritization strategies, enhanced VPR performs as well or better in terms of correctly highlighting CVEs that are actively exploited in the wild. However, it is on efficiency of effort that the enhanced version really excels. Those similar levels of coverage are achieved despite the enhanced VPR strategies prioritizing far fewer CVEs than the alternatives. This gain in efficiency sets VPR apart from the competing prioritization strategies.
How common vulnerability prioritization strategies perform against recent high-profile vulnerabilities
The above analysis shows how each strategy performs against vulnerabilities actively exploited in the wild. Since there is no way to know which CVEs are being exploited at any given time, the first comparison approximates this based on observed indicators of exploitation. The same definition of exploited in the wild is used as was used to train the enhanced VPR model which introduces some bias. To solve for this, another view would be to compare how each strategy performs against a list of recent high-profile vulnerabilities — publicized CVEs that are known to have been exploited — that we would expect to be prioritized. We can compare the number of high-profile CVEs prioritized by each strategy, but we must also keep in mind the total number of CVEs prioritized by each strategy. The best strategy would be the one that prioritizes the most high-profile CVEs balanced with a small total number of prioritized CVEs. This combination allows security teams to work efficiently without compromising on safety.
Google Project Zero
The Project Zero team at Google maintains a publicly available dataset containing publicly known cases of detected zero-day exploits. The prioritization strategies discussed above are compared against the list of 13 such vulnerabilities that were disclosed between January 1, 2025 and March 24, 2025. We would expect each of the strategies to prioritize a high percentage of these CVEs since they are high profile, exploited in the wild and relatively recently published.
In assessing the performance of each strategy, the total number of CVEs prioritized must also be taken into account. The chart below shows the number of Google Project Zero CVEs that were prioritized by each of the strategies alongside the total number of CVEs prioritized by each strategy.
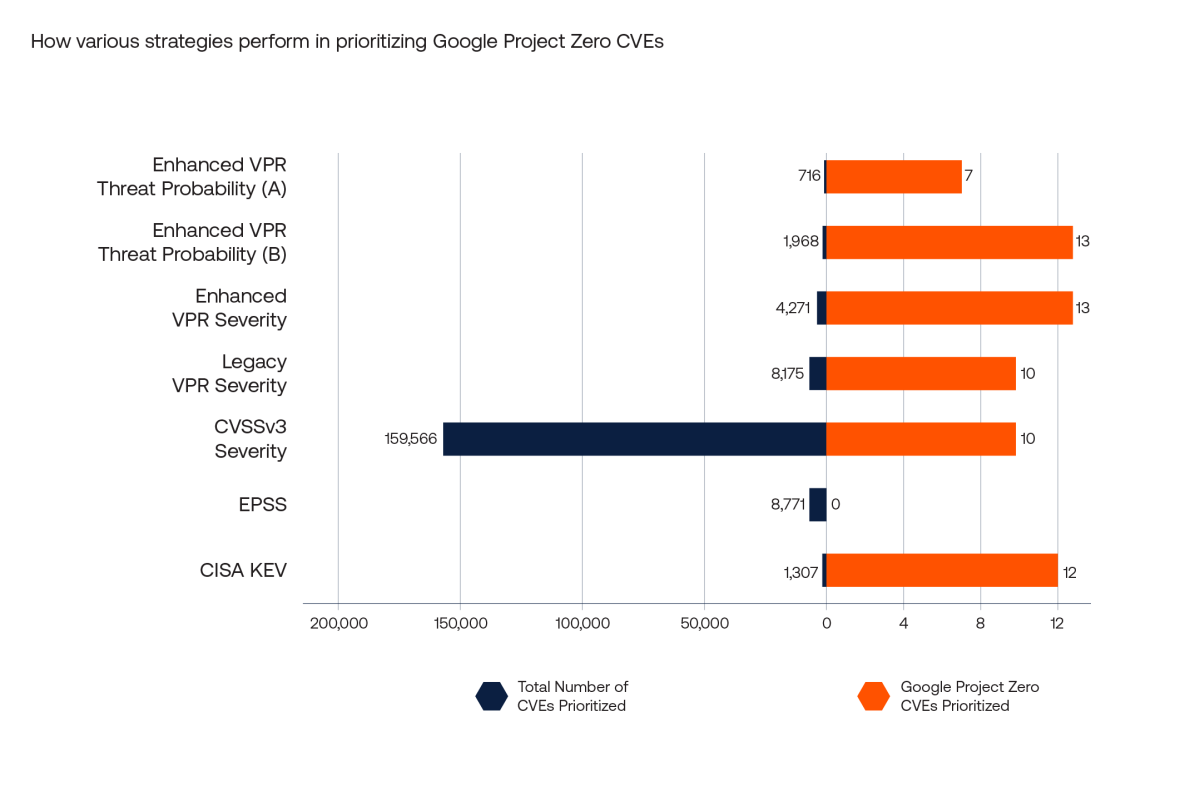
Enhanced VPR Threat Probability (B) and Enhanced VPR Severity outperform all other strategies relative to Google Project Zero CVEs as they both prioritize all 13 of these CVEs for remediation. The Legacy VPR Severity and CVSSv3 Severity perform similarly in prioritizing a high percentage of Google Project Zero CVEs. Note, however, the disparity in the total number of CVEs prioritized: As with our previous analysis, in this case each of the enhanced VPR strategies prioritize the smallest numbers in total by some distance (with the exception of CISA KEV), making these strategies much more efficient. CISA KEV identifies 12 of the 13 Google Project Zero CVEs for prioritization, but it is not a forward-looking strategy and performs badly in terms of coverage of newly exploited vulnerabilities. That is shown by the low coverage of this strategy against the exploited in the wild vulnerabilities in the Performance vs. Observed Exploitation section above.
The Enhanced VPR Threat Probability (A) strategy only identified 7 of the CVEs as it tries to balance coverage and efficiency. However, Enhanced VPR Threat Probability (B), which emphasizes coverage over efficiency, prioritizes all 13 CVEs. EPSS, by contrast, identifies a total of 8,771 CVEs for remediation which is more than Enhanced VPR Threat Probability (A), Enhanced VPR Threat Probability (B) and Enhanced VPR Severity strategies. Despite that, it does not prioritize any of these CVEs for remediation.
Conclusion
The number one performance goal of VPR is to efficiently prioritize for remediation those CVEs that will be associated with near-term exploitation activity in the wild, whilst also taking into account the expected impact of any such exploitation. In this respect, the goal is to build on the efficiency of the legacy version by prioritizing an even smaller set of CVEs without any deterioration in the coverage of active threats.
This goal is clearly achieved as the Enhanced VPR Severity strategy prioritizes half as many CVEs as the Legacy VPR Severity strategy with no loss in terms of coverage. The additional information provided with the enhanced version also opens the door for you to create threat probability-based strategies that can offer further efficiency gains or even use threat probability as an extra layer in your prioritization strategy.
Enhanced VPR is currently available in Tenable Vulnerability Management. The enhancements to VPR will enable Tenable customers to:
- improve the efficiency of their remediation efforts
- reduce the alert fatigue that can result from the avalanche of findings generated by other strategies
- create new, customized risk-based remediation strategies based on threat probability
- focus their efforts on the threats that matter most
Learn more
- To learn more about the enhancements made to VPR, check out our technical white paper.
- Ready to see VPR in action? Start a free trial of Tenable Vulnerability Management today.
Learn more

Learn more
Related articles


- Exposure Management
- Vulnerability Management
Tenable One
Request a demo
The world’s leading AI-powered exposure management platform.
Thank You
Thank you for your interest in Tenable One.
A representative will be in touch soon.
Form ID: 7469
Form Name: one-eval
Form Class: c-form form-panel__global-form c-form--mkto js-mkto-no-css js-form-hanging-label c-form--hide-comments
Form Wrapper ID: one-eval-form-wrapper
Confirmation Class: one-eval-confirmform-modal
Simulate Success