by Cody Dumont
Establishing a starting point, which can improve an organizations security posture to provide the greatest protection against threats and vulnerabilities, is beneficial to every security program. New or unknown devices, software, applications, and vulnerabilities on an organization's network pose a great risk to the organization. Continuous monitoring for vulnerabilities, including new/unknown devices, and proactively addressing discovered flaws could reduce the risks of network compromise, data theft, or destruction.
This dashboard provides a high-level overview that aligns with the Top 5 Priorities of the National Cyber Hygiene Campaign: “Count, Configure, Control, Patch, and Repeat”.
As defined by the Center for Internet Security (CIS), the Critical Security Controls (CSC) are a relatively small number of prioritized, well-vetted, and supported security actions that organizations can take to assess and improve their current security state. Developed based on specific knowledge of the threat environment and currently available technologies, the Controls are informed by actual attacks and effective defenses and reflect the combined knowledge of many experts.
The National Cyber Hygiene Campaign was developed as a foundation to assist in implementing the CIS Critical Security Controls. The campaign begins by asking five questions that align with the first five CSC categories: What is connected to the network? What software is running on the network? Are you managing your systems? Are you looking for known bad software? Do you track those with administrative privileges?
Analysts can use this dashboard to easily drill down into the data to determine further steps that can be the most beneficial in securing the network. Knowing these details can enable better and more efficient vulnerability management strategies within the organization. Subsequently the organization may be better protected from exploitation of network vulnerabilities, and potential intrusions, attacks, and data loss.
This dashboard and its components are available in the Security Center Feed, a comprehensive collection of dashboards, reports, Assurance Report Cards, and assets. The dashboard can be easily located in the Security Center Feed under the category Security Industry Trends. The dashboard requirements are:
- Security Center 5.3.1
- Nessus 8.5.1
- NNM 5.9.1
- Compliance data
Tenable's Security Center is the market-defining continuous network monitoring solution. Security Center includes active vulnerability detection with Nessus and passive vulnerability detection with Tenable Nessus Network Monitor (NNM). Using Security Center, an organization will obtain the most comprehensive and integrated view of its network vulnerabilities.
The following components are included in this dashboard:
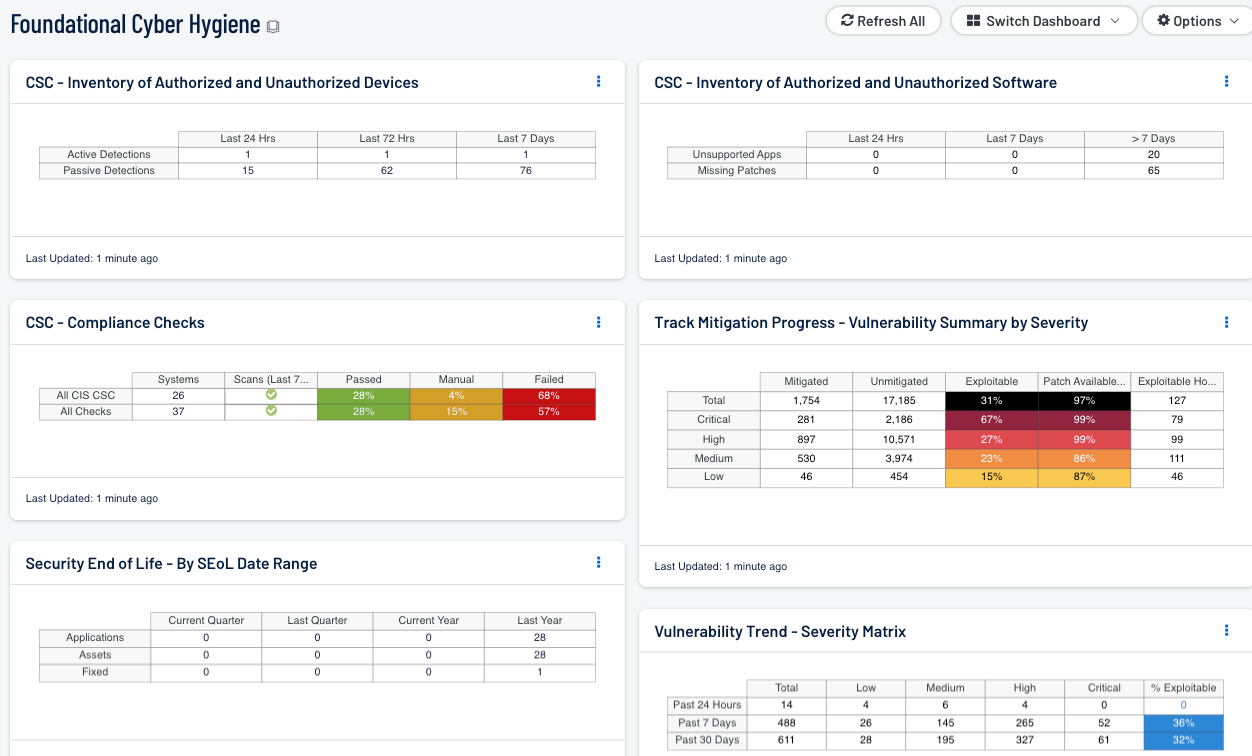
- CSC - Inventory of Authorized and Unauthorized Devices: This component displays new hosts detected within the last 24 hours, 72 hours, and 7 days. Includes NNM and Nessus. NNM is not required for this component to function, but it does provide additional functionality.
- CSC - Inventory of Authorized and Unauthorized Software: Utilizing Nessus active scan results, this component detects unsupported applications, and missing patches. Reporting timeframes are within the last 24 hours, 72 hours, and 7 days.
- CSC - Compliance Checks: This component presents the results of compliance audits to verify secure system configurations. There are two rows, one for compliance checks specific to the CIS Critical Security Controls and one for all compliance checks. Each row includes the system count, whether scans were performed in the last 7 days, and the percentage of checks that passed, failed, or require manual verification. Passed checks are displayed in green, failed checks are in red, and checks that require manual verification are in orange. Clicking on a highlighted indicator will bring up the vulnerability analysis screen to display details on the compliance checks and allow further investigation. In the vulnerability analysis screen, setting the tool to IP Summary will display the systems on which the compliance checks are present. Setting the tool to Vulnerability Detail List will display the full details on each compliance check, possibly including further information such as the expected and actual policy values and the specific sections of the various standards to which the compliance check relates.
- Track Mitigation Progress - Vulnerability by Severity: Tenable.sc records when vulnerabilities are discovered, when patches are issued, and when vulnerabilities are mitigated. This component assists in tracking vulnerability mitigations. The matrix presents vulnerability summary information by severity. In the matrix, the row with red is critical severity vulnerability information, the row with orange is high severity, the row with yellow is medium severity, and the row with green is low severity. The Mitigated column displays the total number of mitigated vulnerabilities. The Unmitigated column displays the total number of vulnerabilities that have not yet been mitigated. The Exploitable column displays the percentage of those unmitigated vulnerabilities that are known to be exploitable. The Patch Available column displays the percentage of the unmitigated, exploitable vulnerabilities that have had a patch available for more than 30 days. Ideally, both of these percentages should be 0%, because all exploitable vulnerabilities and all vulnerabilities with patches available should have been mitigated already. The Exploitable Hosts column displays the number of hosts on the network that have unmitigated, exploitable vulnerabilities.
- Vulnerability Trend - Severity Matrix: This component displays counts of vulnerabilities observed in the past 24 hours, 7 days, and 30 days. The columns display vulnerability counts by severity level and a percentage bar shows the ratio of exploitable vulnerabilities. This component provides insight into whether detected vulnerabilities are exploitable as well as whether mitigation efforts are effective over time.
- Security End of Life - By SEoL Date Range - The Security End of Life Summary matrix displays the count of applications that are no longer supported by vendors, assets with unsupported applications, and mitigated assurances of the unsupported applications over different time periods.
Tenable One
Request a demo
The world’s leading AI-powered exposure management platform.
Thank You
Thank you for your interest in Tenable One.
A representative will be in touch soon.
Form ID: 7469
Form Name: one-eval
Form Class: c-form form-panel__global-form c-form--mkto js-mkto-no-css js-form-hanging-label c-form--hide-comments
Form Wrapper ID: one-eval-form-wrapper
Confirmation Class: one-eval-confirmform-modal
Simulate Success