by Cody Dumont
Service Level Agreements often change from one organizations to the next, however meeting SLA’s is a common issue among organizations industry wide. Tenable.sc provides a vast array of data that provides vulnerability management SLA metrics, but where can the CISO get started? This dashboard is commonly used by the sales team at Tenable to help coach organizations to meet SLA’s. The components in this dashboard are grouped in 3-series, which provide a CISO and Risk Manager with a starting point for SLA analysis.
The first few rows provide a detailed analysis on SLA’s for vulnerabilities based on Common Vulnerability Scoring System (CVSS) and Vulnerability Priority Rating (VPR). Traditionally many SLA’s are based on Microsoft’s Patch Tuesday and provide organizations a period of 30 days to apply newly released patches. While this is common, with Tenable’s VPR score the Risk Managers can now better understand the risk to an environment when a vulnerability is detected. For example, a vulnerability with a medium severity could be actively exploited, and therefore be more urgent to mitigate via patches or configuration. The VPR score provides data intelligence to better prioritize mitigation efforts. The four matrices in this section provide a side-by-side summary of mitigation efforts based on the CVSS and VPR, while on the far right the trending over the past 90 days is provided to illustrate risk to the organization over time.
The second grouping provides overall asset detection and inventory metrics. Starting in the upper-left corner, the number of systems with completed audit checks is displayed, down to authentication statuses. The trend line on the far right provides a history of asset counts via passive and active detections. The remaining components provide a different aspect of asset inventory and a different view of the risk analysis needed to fully understand how an organization is meeting the required SLA’s.
The remaining components provide examples of how analysts can focus on specific vulnerabilities. For example, the Spectre/Meltdown vulnerabilities are detected using the CVE related to the vulnerability. Also,the most critical hosts based on VPR score are also provided. There are several different views based on different tools. For example, the Remediation Summary tools provides a series of patches available to mitigate the most risk. There are two examples, one based on the VPR score, the other based on CVSS severity. The organization can compare the two results to better understand the necessary actions needed to achieve the most risk mitigation. “The List OS Tool” provides the CISO with an understanding of the operating systems found on the network, and “User Responsibility Tools” allows the CISO to understand how risk is distributed among group administrators.
All of these components together provide a starting point, which is useful throughout the Tenable customer base. Organizations are encouraged to install this dashboard and set the focus to different repositories, dynamic assets, or static assets, allowing for risk to be analyzed separately. Administrators can also use this dashboard as a starting to point to create their own dashboard, by installing the dashboard, setting focus, and then copying the components to a common dashboard. Overall this dashboard is a great place to start when upstanding the SLA compliance.
The dashboard and its components are available in the Tenable.sc Feed, a comprehensive collection of dashboards, reports, assurance report cards and assets. The dashboard can be easily located in the Tenable.sc Feed under the category Security Industry.
The dashboard requirements are:
- Tenable.sc 5.12.0
- Nessus 8.8.0
Tenable.sc Continuous View (CV) provides organizations with proactive continuous network monitoring to identify the newest threats across the entire enterprise. Tenable.sc CV enables the organization to react to advanced threats, zero-day vulnerabilities and new forms of regulatory compliance. Tenable.sc CV supports more technologies than any other vendor including operating systems, network devices, hypervisors, databases, tablets, phones, web servers, and critical infrastructure.
This dashboard contains the following components:
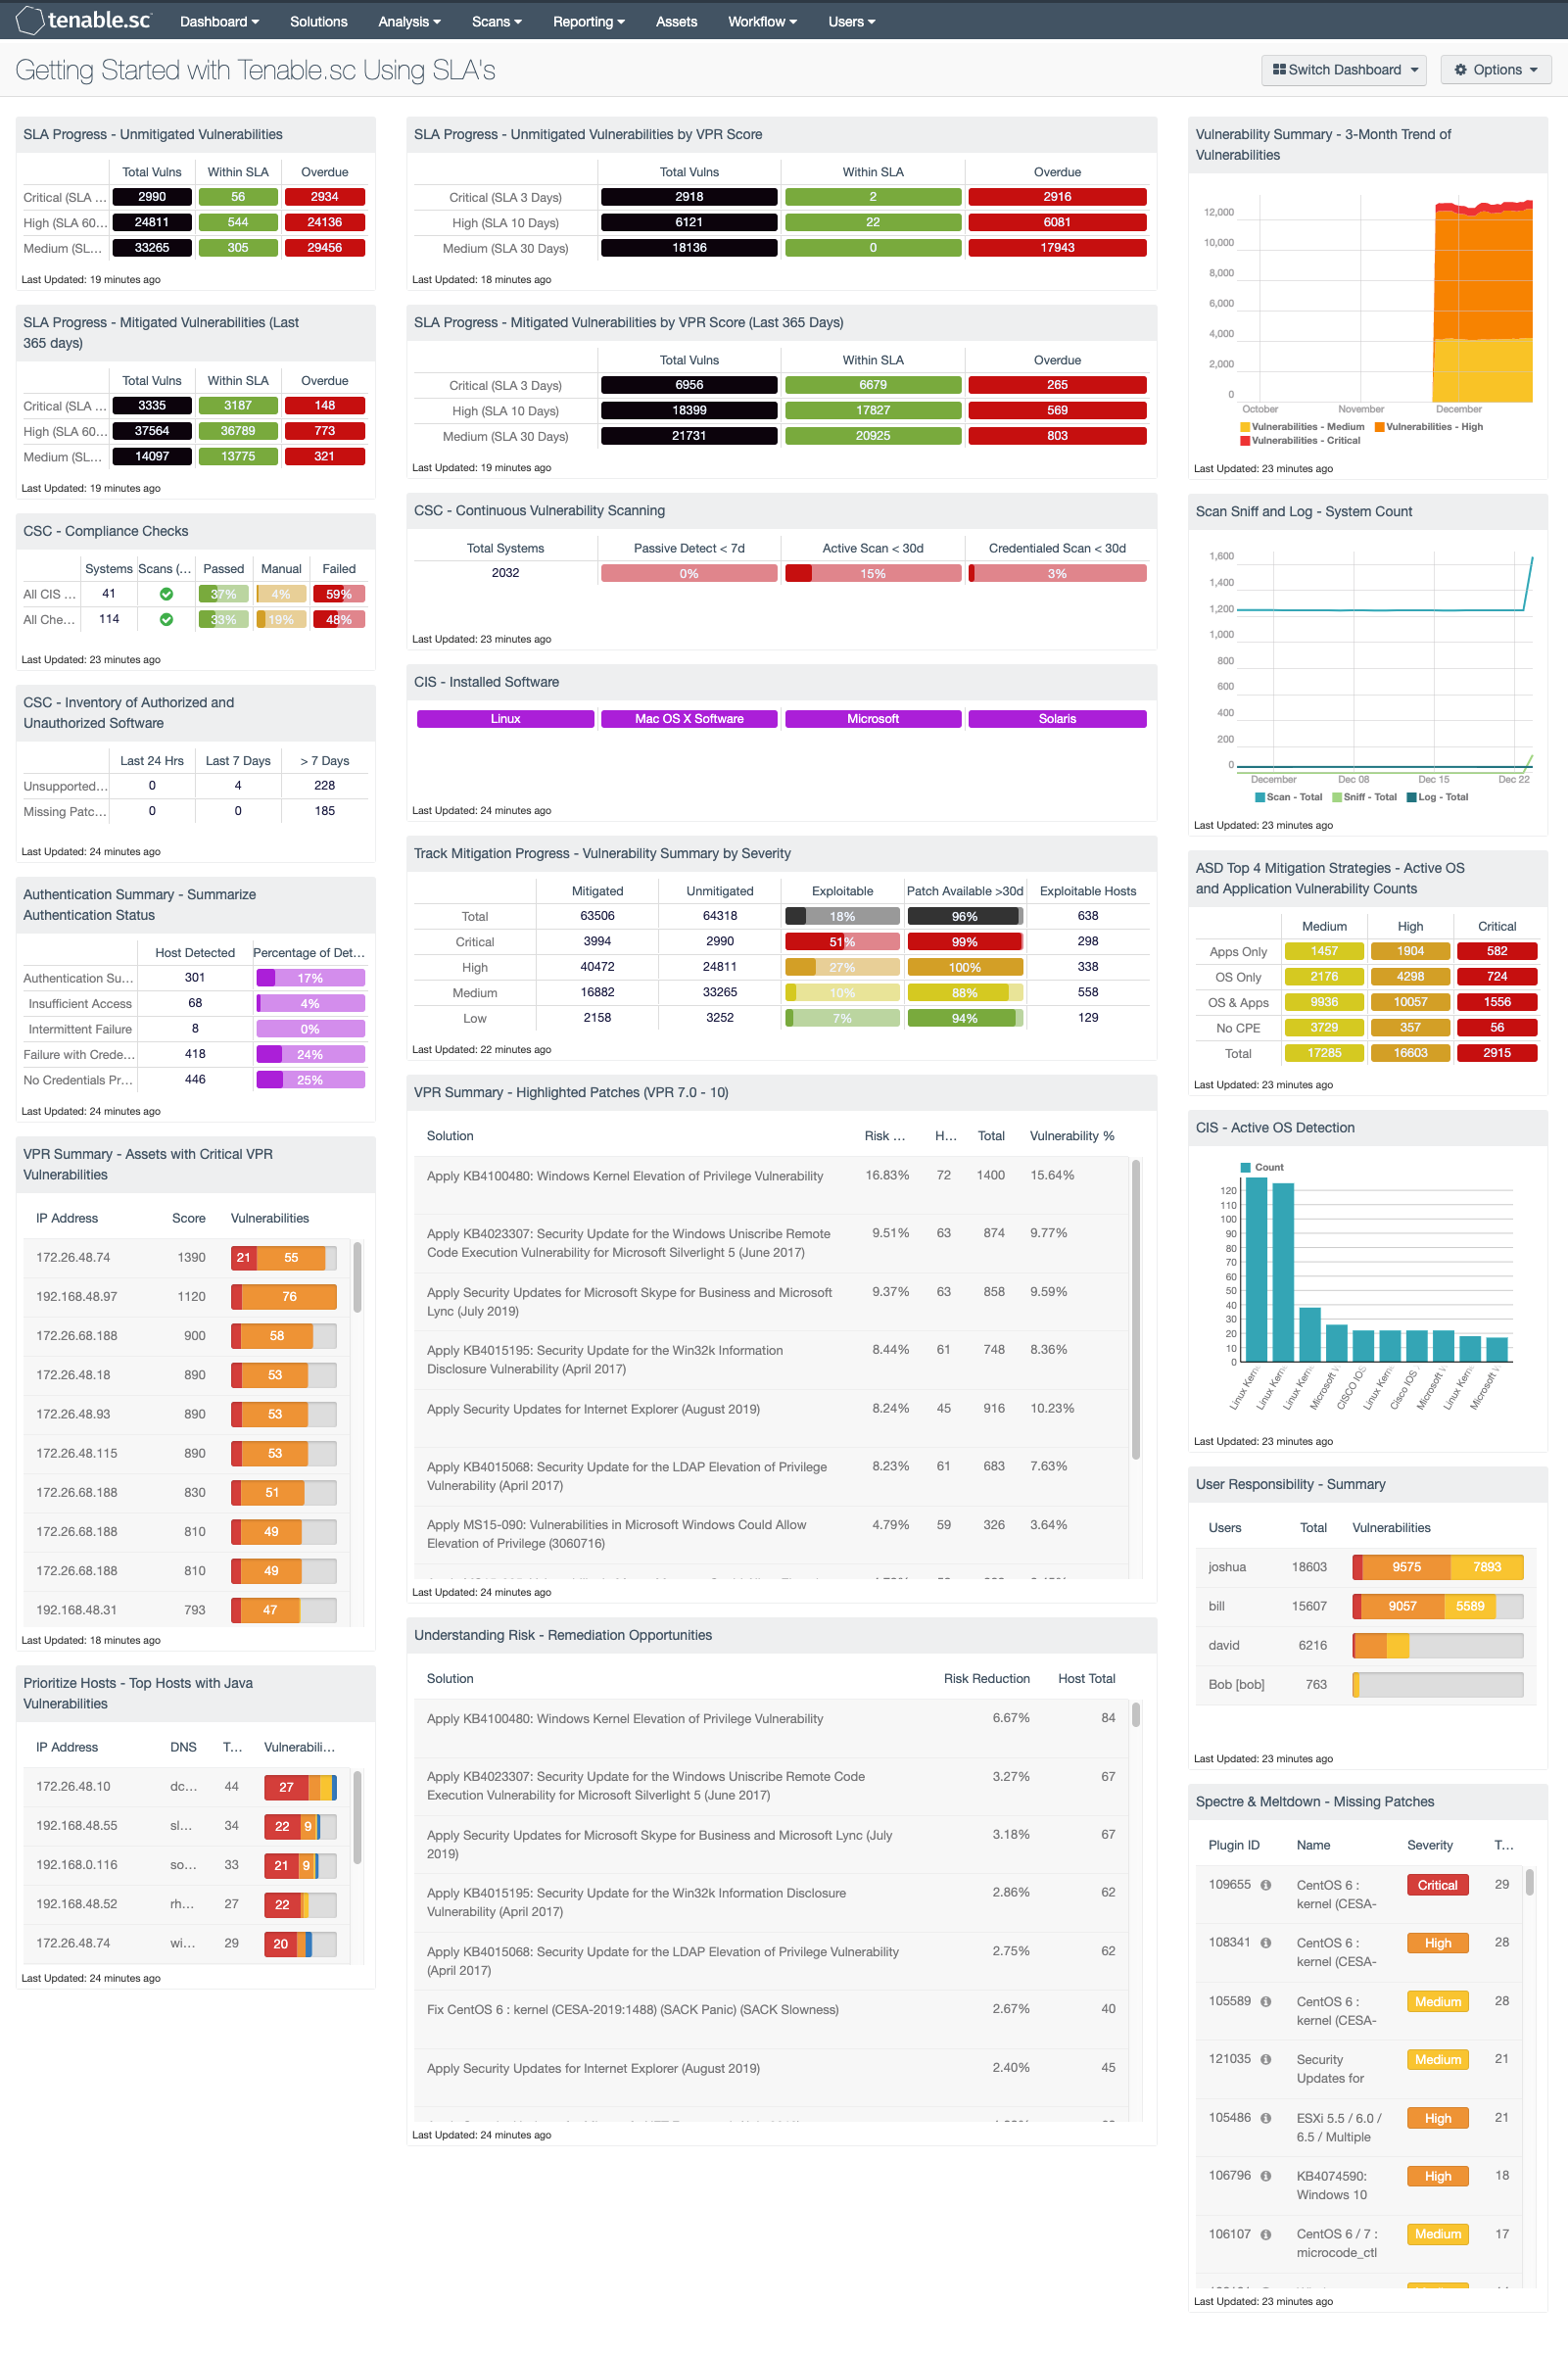
SLA Progress - Unmitigated Vulnerabilities: The matrix provides a summary of vulnerabilities based on the CVSS score and the SLA of 30, 60, 90 days. Each of the three rows are based on the CVSS severity from Medium to Critical. The three columns illustrate the count of vulnerabilities across all systems. To provide more focus to an asset group, the component can be installed with focus option set accordingly. The black cells are the count of vulnerabilities, with green meaning newly discovered and are within the prescribed SLA, while the red count are vulnerabilities that have been detected on the network for more than the allotted mitigation time.
SLA Progress - Mitigated Vulnerabilities (Last 365 days): The matrix provides a summary of the mitigated vulnerabilities discovered over the past 365 days. The rows depict the time required to mitigate (30, 60, 90 days) and the CVSS severity level. The three columns illustrate the count of vulnerabilities across all systems. To provide more focus to an asset group, the component can be installed with focus option set accordingly. The black cells are the count of vulnerabilities, with green meaning newly discovered and are within the prescribed SLA, while the red count are vulnerabilities that have been detected on the network for more than the allotted mitigation time.
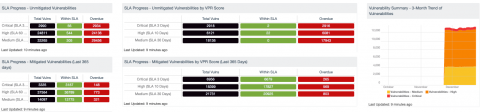
CSC - Compliance Checks: This component presents the results of compliance audits to verify secure system configurations. There are two rows, one for compliance checks specific to the CIS Critical Security Controls and one for all compliance checks. Each row includes the system count, whether scans were performed in the last 7 days, and the percentage of checks that passed, failed, or require manual verification. Passed checks are displayed in green, failed checks are in red, and checks that require manual verification are in orange. Clicking on a highlighted indicator will bring up the vulnerability analysis screen to display details on the compliance checks and allow further investigation. In the vulnerability analysis screen, setting the tool to IP Summary will display the systems on which the compliance checks are present. Setting the tool to Vulnerability Detail List will display the full details on each compliance check, possibly including further information such as the expected and actual policy values and the specific sections of the various standards to which the compliance check relates.
CSC - Inventory of Authorized and Unauthorized Software: Knowing the count of unsupported applications and systems with missing patches on the network is crucial when assessing the vulnerability of the asset. This component shows the count of applications that either require patches or are unsupported by the vendor. Based the organization’s scanning cadence, this component will help bring focus to the time of discovery. If the time between scans is greater than 7 days, the last observed filters can be modified to better align with scanning cadence.
Authentication Summary - Summarize Authentication Status: This matrix provides an overall authentication summary of the systems that have been scanned. The plugins used provide summaries of overall authentication status for the target. A given target should trigger at least one of these plugins. The matrix provides two columns, the “Host Detected” column provides a host count with the respective plugin(s), while the “Percentage of Detected Systems” provides a ratio of total systems scanned. The Total Systems scanned is determined by using the Scan Summary (19506) and the Ping (10180) plugins. The “Percentage of Detected Systems” column, if added together, should total 100% showing all systems scanned with Nessus.
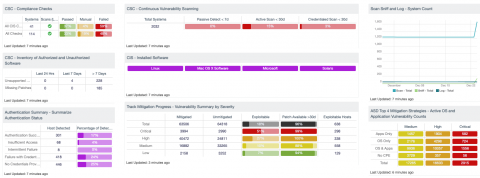
VPR Summary - Assets with Critical VPR Vulnerabilities: This table provides a list of the most critical system on the network based on the VPR score. The table uses the IP Summary tool in conjunction with VPR filter. The table displays system with vulnerabilities with a VPR score of 9.0 – 10. This score portrays the most urgent systems that are in need of mitigation efforts. The table is sorted using the score column, which is the sum of all the vulnerability weights added together to make a comparative value to aid in the quantitative analysis.
Prioritize Hosts - Top Hosts with Java Vulnerabilities: This table displays the top hosts on the network that have actively or passively detected Java vulnerabilities. The list is sorted so that the host with the worst Java vulnerabilities is at the top. A count of vulnerabilities and a bar graph indicating the severity of the vulnerabilities are given for each host. Use this table to determine the hosts with the most Java vulnerabilities on the network.
SLA Progress - Unmitigated Vulnerabilities by VPR Score: The matrix provides a summary of vulnerabilities based on the VPR score and the SLA of 30, 60, 90 days. Each of the three rows are based on the VPR severity from Medium to Critical. The three columns illustrate the count of vulnerabilities across all systems. To provide more focus to an asset group, the component can be installed with focus option set accordingly. The black cells are the count of vulnerabilities, with green meaning newly discovered and are within the prescribed SLA, while the red count are vulnerabilities that have been detected on the network for more than the allotted mitigation time.
SLA Progress - Mitigated Vulnerabilities by VPR Score (Last 365 Days): This matrix provides a summary of the mitigated vulnerabilities discovered over the past 365 days. The rows depict the time required to mitigate (30, 60, 90 days) and the VPR severity level. The three columns illustrate the count of vulnerabilities across all systems. To provide more focus to an asset group, the component can be installed with focus option set accordingly. The black cells are the count of vulnerabilities, with green meaning newly discovered and are within the prescribed SLA, while the red count are vulnerabilities that have been detected on the network for more than the allotted mitigation time.
CSC - Continuous Vulnerability Scanning: This matrix assists in monitoring the vulnerability detection and scanning performed by the Tenable Passive Vulnerability Scanner (PVS) and Tenable Nessus. Presented are the percentages of total systems that have had recent passive vulnerability detections, active vulnerability scans, and credentialed scans. This information highlights detection coverage and whether vulnerability scans are being regularly executed. The timeframes may be altered to fit organizational requirements.
CIS - Installed Software: This matrix component utilizes software enumeration plugins to aid the administrators in reviewing software detected on systems. Drilling into each cell provides a listing IP address that have a software inventory collected. The administrator can then pivot using the “Vulnerability Detail List” tool to see a list of software installed on each system. By adding additional filters using the “Vulnerability Text” field, administrators can easily search for systems with specific software installed.
Track Mitigation Progress - Vulnerability Summary by Severity: SecurityCenter records when vulnerabilities are discovered, when patches are issued, and when vulnerabilities are mitigated. This component assists in tracking vulnerability mitigations. In the matrix, the row with red is critical severity vulnerability information, the row with orange is high severity, the row with yellow is medium severity, and the row with green is low severity. The Mitigated column displays the number of vulnerabilities that have been moved to the mitigated database. A vulnerability is moved to the mitigated database when the vulnerability is no longer detected by a rescan; the vulnerability is assumed to be remediated. The Unmitigated column displays the number of current vulnerabilities that are not yet remediated and have not been moved to the mitigated database. The Exploitable column displays the percentage of those unmitigated vulnerabilities that are known to be exploitable. The Patch Available column displays the percentage of the unmitigated, exploitable vulnerabilities that have had a patch available for more than 30 days. Ideally, both of these percentages should be 0%, because all exploitable vulnerabilities and all vulnerabilities with patches available should have been mitigated already. The Exploitable Hosts column displays the number of hosts on the network that have unmitigated, exploitable vulnerabilities.
VPR Summary - Highlighted Patches (VPR 7.0 - 10): The component uses the High and Critical VPR levels (VPR 7.0 - 10) combined with the remediation summary tool to provide a focused view of patches that should be considered at a higher priority than other patches. The tool provides a list of patches to apply, the amount of risk reduced (based on vulnerability weight score), hosts affected, and percentage of vulnerabilities. Using Predictive Prioritization, organizations are able to better understand which vulnerabilities should be mitigated first. Combined with this comprehensive view Tenable.sc provides the list of patches that can have the more immediate impact.
Understanding Risk - Remediation Opportunities: This table displays the top remediations for the network. For each remediation, the risk reduction for the network if the remediation is implemented is shown, along with the number of hosts affected. The table is sorted so that the highest risk reduction is at the top. Implementing the remediations will decrease the overall vulnerability of the network. Adding filters to the component, such as filtering on only critical severity vulnerabilities or filtering on a specific asset group, can narrow the focus of the component, giving remediation opportunities in specific areas.
Vulnerability Summary - 3-Month Trend of Vulnerabilities: This component is a 3-month summary chart tracking unmitigated vulnerabilities of low, medium, high, and critical severity.
Scan Sniff and Log - System Count: 25 day trend of the number of unique systems that have been discovered through sniffing, scanning and log analysis.
ASD Top 4 Mitigation Strategies - Active OS and Application Vulnerability Counts: This component provides a count of the active vulnerabilities discovered on the network based on if the vulnerabilities are for operating systems, applications, or a combination of both. The best method of separating application vulnerabilities from operating system vulnerabilities is to use CPE pattern matching. The first row of the matrix provides a count of Application-only vulnerabilities, followed by the OS Only, OS and Apps, No CPE, and then a total vulnerability count. Each severity level is represented by a color. The cells with medium severity vulnerabilities turn yellow, the high severities turn orange, and the red cells indicate critical severities.
CIS - Active OS Detection: This bar chart provides the summary of operating systems detected using the List OS tool and plugin 11936 (OS Identification). The chart provides the top 10 most prevalent operating systems detected in the network. This view provides analysts with a high-level view of their current network and the systems actively detected. Tenable.sc uses Nessus to actively scan assets and using a wide range of detections methods such as banner grabbing, protocol detections, and advanced finger printing, this component helps organizations to better understand and track risks based on OS detection.
User Responsibility - Summary: This component provides a summary of all Tenable.sc users and the vulnerabilities they are responsible to remediate. The component uses the responsibility tool to monitor risk profile based on the person responsible for securing the systems. However, the responsible person or group will need to have accounts created in Tenable.sc for this component to work correctly.
Spectre & Meltdown - Missing Patches: The Missing Patches component is a table that provides a summary of the top 10 vulnerabilities in relation to CVE-2017-5753, CVE-2017-5715 and CVE-2017-5754. The summary includes the Plugin ID used, the Name, Severity, and total found. This information will give analysts the ability to mitigate the vulnerabilities attributed to most systems affected and significantly reduce their exposure.
Tenable One
Request a demo
The world’s leading AI-powered exposure management platform.
Thank You
Thank you for your interest in Tenable One.
A representative will be in touch soon.
Form ID: 7469
Form Name: one-eval
Form Class: c-form form-panel__global-form c-form--mkto js-mkto-no-css js-form-hanging-label c-form--hide-comments
Form Wrapper ID: one-eval-form-wrapper
Confirmation Class: one-eval-confirmform-modal
Simulate Success