by David Schwalenberg
October 8, 2014
Computer networks do not remain static. An organization that does not understand their network, what devices are on the network, the network connections, and who is talking to whom, will not be able to effectively manage or protect their network. If the inventory and activity on a network is not monitored, unauthorized devices and connections may go unnoticed. These unauthorized changes, no matter how well-intentioned, may lead to security gaps and vulnerabilities that can expose critical systems to attack and sensitive data to exploitation.
This dashboard uses all aspects of SecurityCenter Continuous View (CV), including both active and passive detection and information from log events. The information on this dashboard can assist the organization in better understanding the network, tracking inventory, discovering network connections, and even detecting unauthorized systems and unusual activity.
What systems were recently added to the network? Which ports and users are most active on the network? Which hosts have the most internal connections to which other hosts? Which hosts have outbound external connections? The components on this dashboard can help answer these questions and more. Information on recent network changes as well as indicators of systems by type will assist the organization in maintaining accurate inventory and detecting rogue devices and unauthorized users. Information on the most active systems, ports, and users will assist in tracking normal activity as well as discovering any unusual activity. Information on which hosts are talking to which other hosts will assist the organization in detecting any unauthorized or suspicious connections. In addition, analysts can easily drill down into the data presented to learn more details.
This dashboard is available in the SecurityCenter Feed, a comprehensive collection of dashboards, reports, Assurance Report Cards, and assets. The dashboard can be easily located in the SecurityCenter Feed under the category Discovery & Detection.
The dashboard requirements are:
- SecurityCenter 4.8.2
- Nessus 6.9.0
- LCE 4.8.1
- PVS 5.1.0
- Tenable Network Monitor
- Tenable NetFlow Monitor
For additional information, including details about each host on the network and specifics on which hosts are connecting to which other hosts, see the related Network Mapping Report.
Tenable SecurityCenter Continuous View (CV) is the market-defining continuous network monitoring solution, and helps organizations to know and manage their networks. Active scanning periodically examines systems to discover system information, vulnerabilities, and compliance concerns. Agent scanning enables detection and scanning of transient devices. Passive listening provides real-time monitoring to collect information about systems and vulnerabilities. Host data and data from other security investments is analyzed to monitor activity and identify new devices and users. SecurityCenter CV provides an organization with the most comprehensive view of the network, and the intelligence needed to manage the network in order to safeguard critical assets and information.
Listed below are the included components:
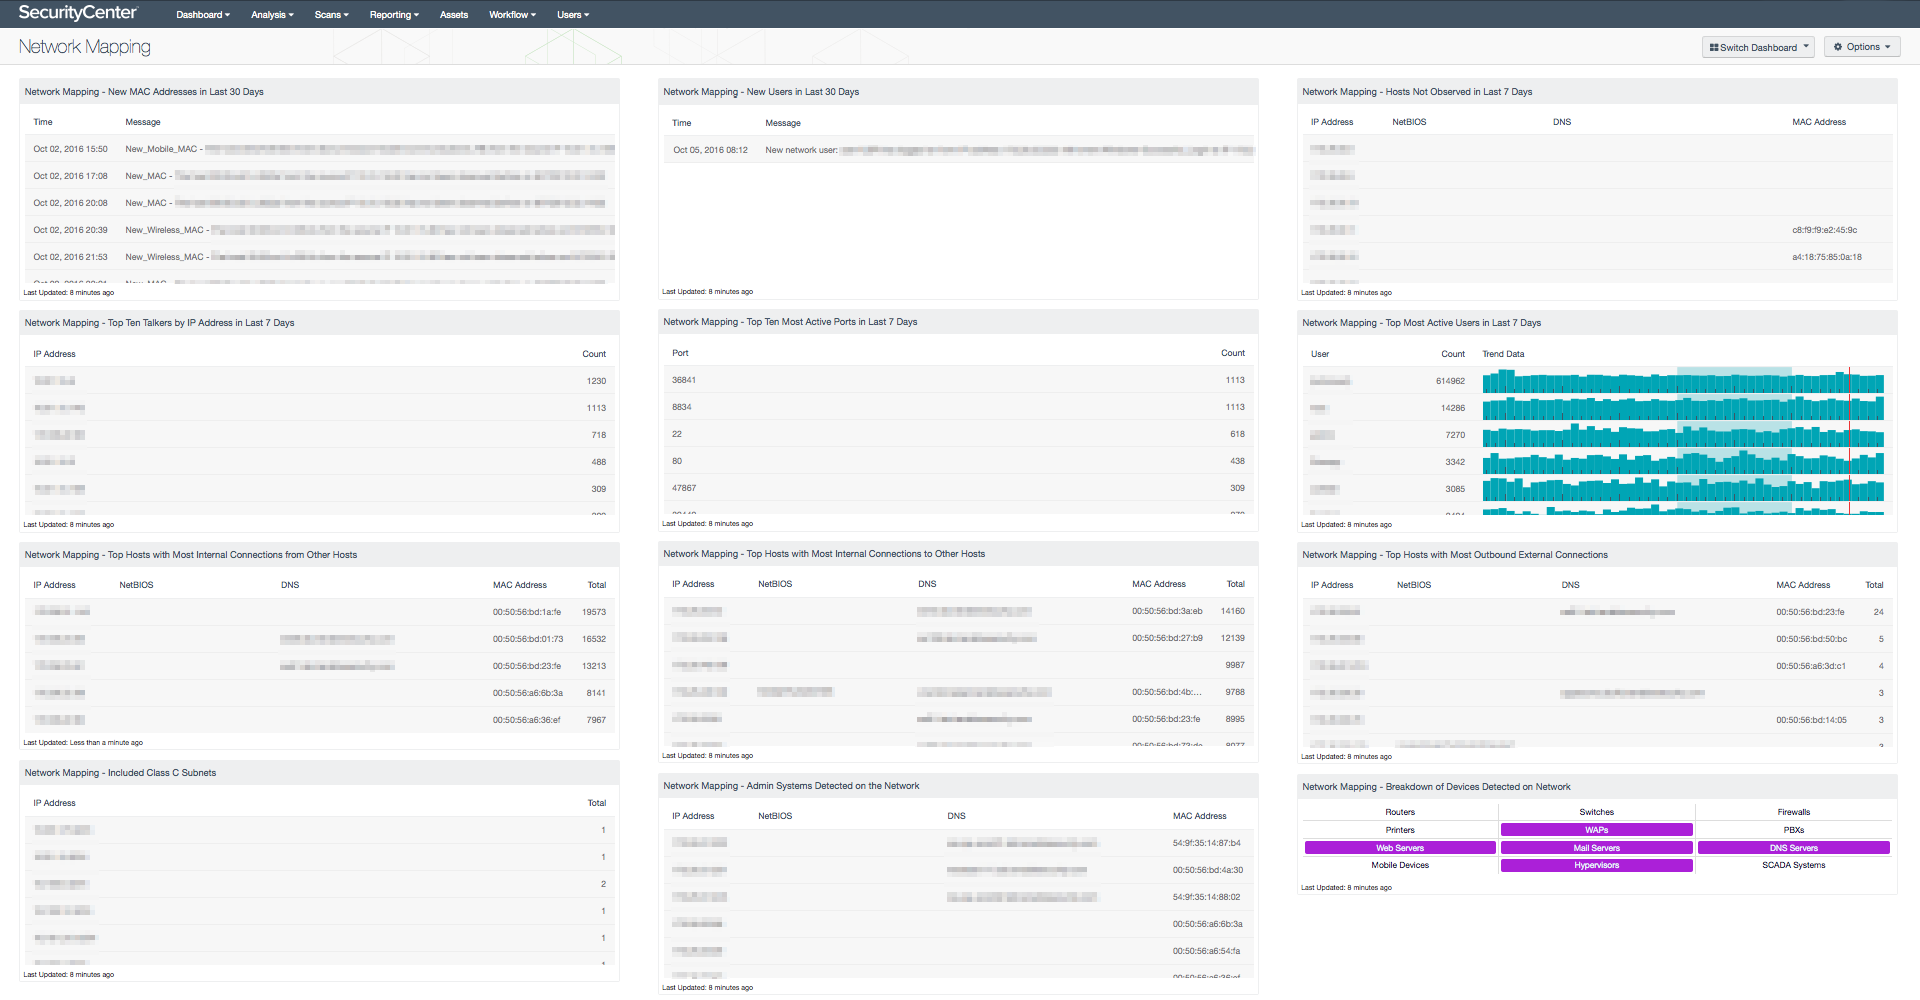
- Network Mapping - New MAC Addresses in Last 30 Days - This table lists all the new MAC addresses that have never been observed before on the network, and that were first observed in the last 30 days. Tenable's LCE sets the New_MAC event when a new, never-before-seen MAC address is observed on the network. This table reports those New_MAC events, displaying the time observed and the raw syslog text, which contains the new MAC address and its associated IP address. Discovering new hosts on the network can assist an organization in maintaining an accurate inventory and detecting rogue devices.
- Network Mapping - New Users in Last 30 Days - This table lists all the new user accounts that have never been observed before on the network, and that were first observed in the last 30 days. Tenable’s LCE sets the new-network-user event when a new, never-before-seen user account logs onto the network. This table reports those new-network-user events, displaying the time observed and the raw syslog text, which contains the new user account, the observed logon event, and the IP addresses from which and to which the user logged on. Discovering new users on the network can assist an organization in detecting possible unauthorized activity.
- Network Mapping - Hosts Not Observed in Last 7 Days - This table lists those systems that were last passively observed on the network more than seven days ago. Tenable's PVS detects hosts on the network and records their last observed date. This table presents host information for any hosts whose last observed date is more than seven days ago. Discovering hosts that have stopped talking on the network can assist an organization in maintaining an accurate inventory and detecting unusual activity.
- Network Mapping - Top Ten Talkers by IP Address in Last 7 Days - This table presents host information for the top ten most active systems on the network in the last seven days based on the number of network traffic events generated. LCE records network traffic events from the Tenable Network Monitor and the Tenable NetFlow Monitor; the most active hosts will have the highest counts of these events. The table is sorted so that the system with the highest count of events is at the top. This information can assist an organization in tracking normal activity, as well as discovering any unusual activity.
- Network Mapping - Top Ten Most Active Ports in Last 7 Days - This table presents the top ten most active ports on the network in the last seven days based on the number of network traffic events generated. LCE records network traffic events from the Tenable Network Monitor and the Tenable NetFlow Monitor; the most active ports will have the highest counts of these events. The table is sorted so that the port with the highest count of events is at the top. This information can assist an organization in tracking normal activity, as well as discovering any unusual activity.
- Network Mapping - Top Most Active Users in Last 7 Days - This table presents the most active users on the network in the last seven days based on the number of network user events generated. The table is sorted so that the user with the highest count of events is at the top. Trend lines of events per user over the last seven days are included. This information can assist an organization in tracking normal activity, as well as discovering any unusual activity. Note that the number of users that the table displays can be adjusted in the component based on the size of the organization, and should typically be 10-15% of the total users on the network.
- Network Mapping - Top Hosts with Most Internal Connections from Other Hosts - This table presents information on those hosts with the most passively detected internal connections from other hosts (Internal Server Trusted Connection). The table is sorted so that the host with the highest count of detections is at the top. This information can assist an organization in understanding who is talking to whom, as well as detecting any unauthorized or suspicious host connections. The Total column displays the number of detections. This number of detections may not equal the number of other hosts connecting to this host, as some detections may include multiple hosts, and multiple connections from the same host may also have been detected. Note that only passively detected internal host connections will be displayed, and this may not include all possible internal connections.
- Network Mapping - Top Hosts with Most Internal Connections to Other Hosts - This table presents information on those hosts with the most passively detected internal connections to other hosts (Internal Client Trusted Connection). The table is sorted so that the host with the highest count of detections is at the top. This information can assist an organization in understanding who is talking to whom, as well as detecting any unauthorized or suspicious host connections. The Total column displays the number of detections. This number of detections may not equal the number of other hosts to which this host is connecting, as some detections may include multiple hosts, and multiple connections to the same host may also have been detected. Note that only passively detected internal host connections will be displayed, and this may not include all possible internal connections.
- Network Mapping - Top Hosts with Most Outbound External Connections - This table presents information on those hosts with the most passively detected outbound external connections. The table is sorted so that the host with the highest count of detections is at the top. This information can assist an organization in understanding who is talking to whom, as well as detecting any unauthorized or suspicious host connections. The Total column displays the number of detections. This number of detections may be greater than the number of external hosts to which this host is connecting, as multiple connections to the same host may have been detected. Note that only passively detected outbound external host connections will be displayed, and this may not include all possible external connections.
- Network Mapping - Included Class C Subnets - This table assists an organization in understanding the scope of its network by grouping all the IP addresses discovered actively by Nessus, passively by PVS, and from log events recorded by LCE into representative Class C subnets. This information can assist an organization in detecting any unauthorized subnets or rogue devices. Note that if the organization has a very large network, this component can be modified to present Class B subnets, if desired. The Total column displays the number of detections. This number of detections may be greater than the number of hosts in each subnet, as each host may have been detected multiple times.
- Network Mapping - Admin Systems Detected on the Network - This table presents those systems that have been observed as the source of a *nix 'root' login or a Windows 'Administrator' or 'admin' authentication. This information assists an organization in determining which systems are used to administer the network and if any of these systems are unauthorized. Note that if the Windows management account has been renamed from 'Administrator' to something else, appropriate text can be added in the Vulnerability Text of this component.
- Network Mapping - Breakdown of Devices Detected on Network - This matrix presents a breakdown of detected network systems by type. A purple indicator denotes that systems of that type were detected; clicking on the indicator will bring up information on each of the detected systems, including IP address and MAC address. This information can assist an organization in maintaining an accurate inventory and detecting any unauthorized systems. The type of the network system is determined either based on its operating system (OS) or by the actively or passively detected vulnerabilities it has. Indicators are included for routers, switches, firewalls, printers, wireless access points (WAPs), PBXs, web servers, mail servers (IMAP, POP, and SMTP servers, as well as other specific servers such as Microsoft Exchange), DNS servers, mobile devices, hypervisors (virtual machines), and SCADA systems.