by Josef Weiss
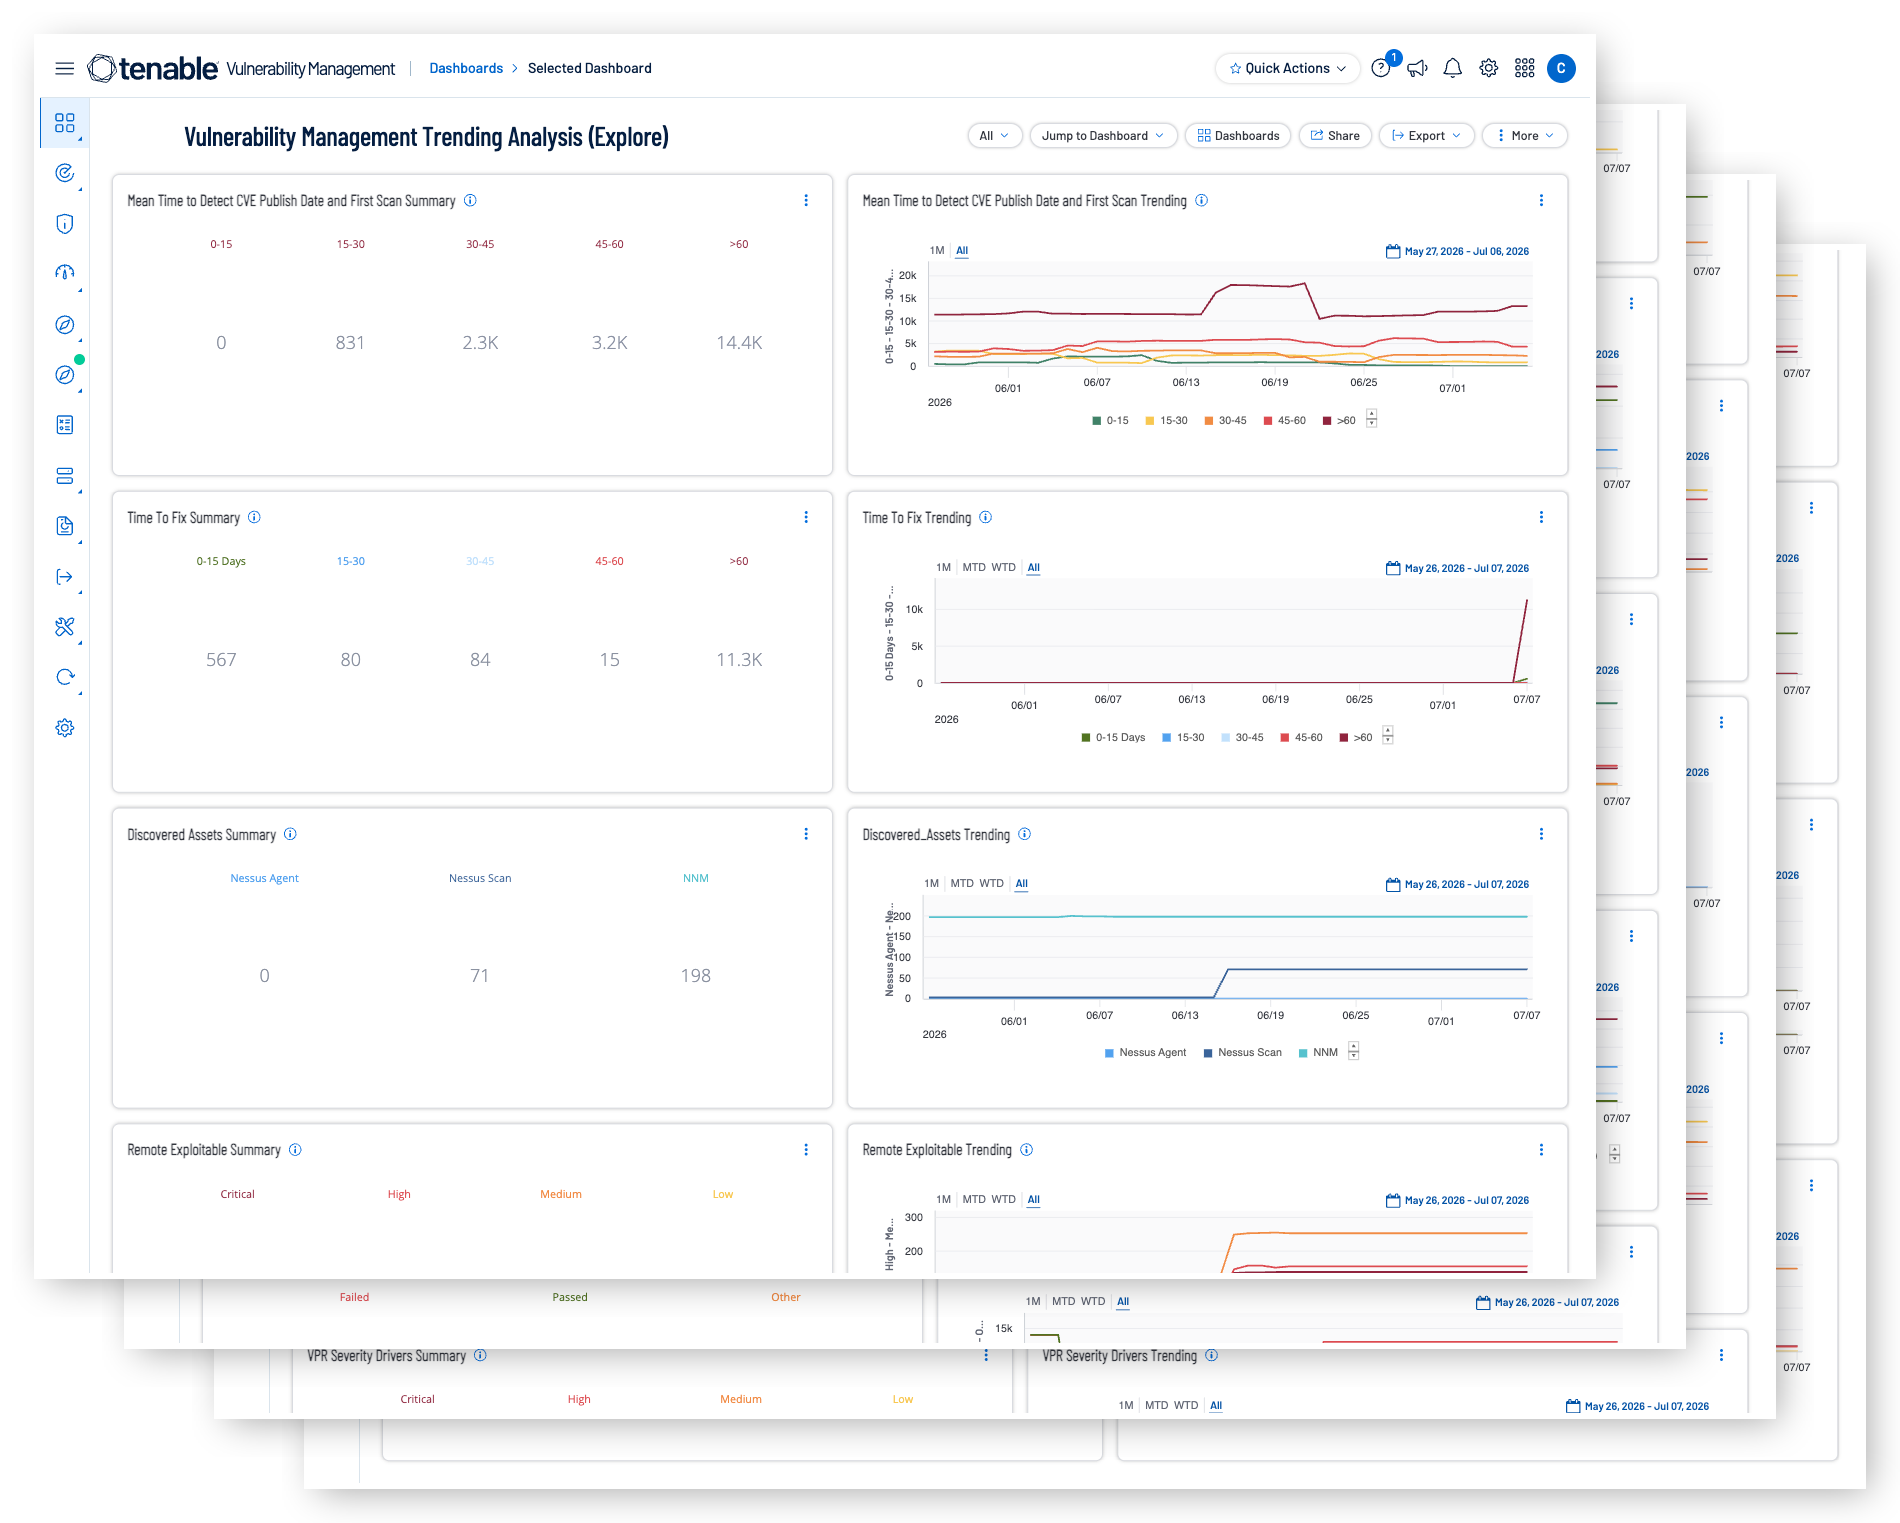
Organizations face a persistent challenge in translating vulnerability data into actionable risk intelligence that drives timely remediation decisions across diverse attack surfaces. Security Managers struggle to communicate the true business impact of technical findings to executive stakeholders, while Security Engineers contend with overwhelming volumes of vulnerability data that obscure the most critical threats requiring immediate attention. Without unified visibility into vulnerability trends, remediation velocity, compliance drift, and risk prioritization metrics, security teams operate reactively rather than strategically. The VMD Trending Dashboard solves this by consolidating vulnerability management signals into a cohesive view that supports the 'See Everything' principle, enabling organizations to gain comprehensive visibility across IT, cloud, and emerging technology domains while focusing remediation efforts on exposures that matter most to business risk.
Security Managers need executive-ready insights that translate technical vulnerability metrics into strategic risk narratives for board reporting and resource allocation decisions. The dashboard addresses this requirement by surfacing trends in vulnerability state counts, VPR-scored exposures, compliance benchmark performance, and asset discovery patterns that reveal whether security posture is improving or degrading over time. These time-based visualizations allow Security Managers to demonstrate program effectiveness, justify remediation investments, and identify periods where response capacity may have been constrained by competing priorities. When critical vulnerability counts rise or compliance pass rates decline, Security Managers can escalate these signals to executive leadership with context about business impact and urgency. The dashboard transforms raw technical data into a strategic communication tool that bridges the gap between vulnerability management operations and business risk discussions with C-level stakeholders.
Security Engineers require operational precision and data completeness to ensure that vulnerability assessments accurately reflect the organization's true security state and that remediation efforts target the highest-impact exposures. The dashboard supports this operational need by tracking scan health indicators, mean time to detect metrics, and remediation velocity trends that reveal whether vulnerability management processes are functioning reliably across the infrastructure. Security Engineers use these operational metrics to identify scan coverage gaps, configuration issues, or environmental problems that could create blind spots in vulnerability visibility. When scan health findings increase or detection lag times extend beyond acceptable thresholds, Security Engineers can proactively address infrastructure issues before they compromise the accuracy of risk assessments. The dashboard provides Security Engineers with the data integrity signals necessary to maintain stakeholder confidence in vulnerability management program outputs and ensure that remediation prioritization decisions are based on complete and current information.
The widget collection reveals a multi-dimensional view of vulnerability risk prioritization through VPR scoring, CISA Known Exploited Vulnerabilities tracking, and Asset Criticality Rating analysis that embodies the 'Predict What Matters' principle. VPR-based visualizations isolate vulnerabilities with high exploitation probability scores and critical severity drivers, allowing organizations to focus remediation resources on exposures most likely to be weaponized by adversaries. Tracking CISA KEV catalog entries provides real-time visibility into vulnerabilities with confirmed exploitation activity in the wild, creating an urgent remediation pipeline for threats already being used in active attacks. Asset-centric views show where licensed infrastructure is growing, where discovered assets require assessment, and how vulnerability concentrations map to critical business systems. Together, these risk prioritization signals enable organizations to move beyond generic CVSS scoring toward machine learning informed remediation strategies that align technical patch management with actual business impact.
Compliance posture monitoring through CIS benchmark tracking and remediation velocity measurement through time-to-fix trends provide essential operational health signals that support the 'Act with Confidence' principle. CIS compliance visualizations reveal whether systems maintain adherence to industry-standard security baselines or experience configuration drift that creates exploitable weaknesses across the infrastructure. Time-based metrics showing remediation velocity, mean time to detect, and vulnerabilities fixed within target windows demonstrate whether security programs are responding to emerging threats with adequate speed and consistency. Artificial intelligence system vulnerability tracking extends visibility into emerging technology domains that may lack traditional security control coverage, ensuring that AI and machine learning deployments do not become unmonitored blind spots. Scan health monitoring provides the foundational data integrity assurance that all other vulnerability metrics depend on, alerting teams when scanning infrastructure issues threaten to compromise visibility. These operational and compliance signals collectively demonstrate whether vulnerability management processes are functioning effectively or require program adjustments to meet organizational risk tolerance.
By unifying vulnerability intelligence, compliance monitoring, asset visibility, and remediation tracking into a single coordinated view, the dashboard enables organizations to transition from reactive firefighting to proactive risk reduction aligned with the Unify Vision, Unify Insight, and Unify Action framework. The dashboard is laid out in such a way that the user is able to drill into the value box widget related to the trend line to investigate the findings. Security Engineers use the dashboard to identify and address data quality issues, maintain scan coverage integrity, and validate that vulnerability assessments reflect current infrastructure state before remediation prioritization occurs. Security Managers leverage the same data to translate technical findings into business risk language for executive reporting, demonstrate program effectiveness through trend analysis, and justify resource allocation decisions based on measurable security posture improvements. This collaborative workflow ensures that vulnerability management operates as an integrated organizational capability rather than a siloed technical function. The dashboard transforms vulnerability data into strategic intelligence that supports informed decision making at every organizational level, from tactical patch deployment to board-level risk governance discussions.
Widgets
- Mean Time to Detect CVE Publish Date and First Scan Summary - This widget measures the average time gap between when a vulnerability is published by vendors and when it is first detected in your environment through scanning.
- Mean Time to Detect CVE Publish Date and First Scan Trending - This widget tracks vulnerability detection lag by measuring the time gap between CVE publication and first scan detection across your environment.
- Time To Fix Summary - This widget tracks the count of vulnerabilities that have been remediated within a 14-day window, focusing on findings with non-informational severity levels observed in the last 30 days.
- Time To Fix Trending - This widget visualizes the trend of vulnerabilities remediated within 14 days over time, showing whether the organization is accelerating or slowing its fix rate for moderate to critical findings.
- Remote Exploitable Summary - This widget counts critical-severity vulnerabilities with confirmed remote exploitability and available exploit code, focusing on active, new, or resurfaced findings observed in the last 30 days.
- Remote Exploitable Trending - This widget tracks the trend of remotely exploitable critical vulnerabilities with available exploit code, showing whether exposure to the highest-priority threats is increasing or decreasing over time.
- Discovered Assets Summary - This widget counts assets discovered via Nessus Agent that have not yet been assessed for vulnerabilities, grouped by asset type.
- Discovered Assets Trending - This widget visualizes the trend of unassessed assets discovered by Nessus Agents over time, showing whether the backlog of newly discovered infrastructure is growing or shrinking.
- Compliance Result Summary - This widget measures the count of passed compliance checks observed during host audits, focusing on findings that have not been accepted or marked as exceptions.
- Compliance Result Summary Trend - This widget tracks the trend of passed compliance audit results over time, providing Security Managers with a longitudinal view of configuration management effectiveness and policy adherence.
- Scan Health Summary - This widget monitors specific scan health indicators by tracking findings related to three plugin IDs known to signal scanning issues or environmental problems that affect vulnerability detection accuracy.
- Scan Health Trending - This widget visualizes the trend of scan health findings over time, allowing Security Managers to monitor whether scanning infrastructure and processes are degrading, stable, or improving.
- Vulnerability Intelligence Category Summary - This widget counts active, new, or resurfaced vulnerabilities that appear on the CISA Known Exploited Vulnerabilities catalog, focusing on unaccepted findings with non-informational severity observed in the last 30 days.
- Vulnerability Intelligence Category Trending - This widget visualizes the trend of CISA Known Exploited Vulnerabilities present in the environment over time, showing whether exposure to actively exploited threats is increasing, decreasing, or holding steady.
- CIS Compliance Result Summary - This widget tracks the count of failed CIS benchmark compliance checks observed in the last 30 days, excluding findings that have been accepted or marked as exceptions.
- CIS Compliance Result Trending - This widget visualizes the trend of failed CIS benchmark compliance checks over time, showing whether configuration drift is worsening or improving across the infrastructure.
- Vulnerability State Count Summary - This widget counts critical-severity vulnerabilities in active, new, or resurfaced states observed within the last 30 days, excluding findings marked as accepted risks.
- Vulnerability State Count Trending - This widget tracks the trend of critical-severity vulnerabilities in active, new, or resurfaced states over time, providing Security Engineers with a longitudinal view of critical vulnerability backlog dynamics.
- AI Findings by Severity Summary - This widget monitors critical-severity vulnerabilities affecting artificial intelligence and machine learning systems, focusing on unresolved findings observed in the last 30 days.
- AI Findings by Severity Trending - This widget visualizes the trend of critical AI-related vulnerabilities over time, allowing Security Managers to assess whether the organization's AI attack surface is growing more or less secure.
- VPR Severity Summary - This widget counts unresolved vulnerabilities with Vulnerability Priority Rating (VPR) scores of 9.0 or higher, representing the most severe findings based on machine learning-driven exploit prediction models.
- VPR Severity Trending - This widget visualizes the trend of high-VPR vulnerabilities (score 9.0+) over time, showing whether exposure to machine learning-predicted high-priority threats is increasing or decreasing.
- VPR Severity Drivers Summary - This widget counts vulnerabilities where the VPR severity driver is classified as CRITICAL, representing findings where machine learning models have identified critical-level exploit likelihood based on threat intelligence.
- VPR Severity Drivers Trending - This widget tracks the trend of vulnerabilities with CRITICAL VPR severity drivers over time, showing whether exposure to vulnerabilities targeted by current threat activity is increasing or decreasing.
- Remediated Critical VPR Findings Summary - This widget counts critical VPR vulnerabilities (score 9.0+) that have been remediated within the last 15 days, focusing on findings observed in the last 90 days.
- Remediated Critical VPR Findings Trending - This widget visualizes the trend of critical VPR vulnerabilities remediated within 15 days, showing whether the pace of high-priority remediation is accelerating or slowing over time.
- Licensed Assets by Source Summary - This widget counts licensed assets discovered via Nessus scanning that were observed within the last 24 hours, grouped by asset type.
- Licensed Assets by Source Trending - This widget visualizes the trend of licensed assets discovered via Nessus scanning over time, allowing Security Managers to monitor infrastructure growth and license utilization patterns.
- Critical Vulnerabilities by ACR - This widget counts critical vulnerabilities on high-value assets by identifying findings with VPR scores of 9.0 or higher on assets with Asset Criticality Rating (ACR) scores of 9.0 or higher.
- Critical Vulnerabilities by ACR Trending - This widget tracks the trend of critical vulnerabilities on critical assets (VPR 9.0+, ACR 9.0+) over time, showing whether the organization's most dangerous exposures are increasing or decreasing.
Tenable One
Request a demo
The world’s leading AI-powered exposure management platform.
Thank You
Thank you for your interest in Tenable One.
A representative will be in touch soon.
Form ID: 7469
Form Name: one-eval
Form Class: c-form form-panel__global-form c-form--mkto js-mkto-no-css js-form-hanging-label c-form--hide-comments
Form Wrapper ID: one-eval-form-wrapper
Confirmation Class: one-eval-confirmform-modal
Simulate Success