by Stephanie Dunn
August 18, 2016
While networks continue to grow in complexity, many organizations will fall short in implementing a consistent and effective patch management policy. Automatic patch management systems can provide an effective method of reducing the number of overall vulnerabilities. This method can unfortunately create additional problems, as some organizations do not test patches prior to deployment, and fail to re-scan systems after deployment to ensure patches have been applied properly. Organizations can easily fall behind in their patch cycle, which can result in additional vulnerabilities and increased risk. This dashboard provides a high-level overview of vulnerabilities reported by Windows Server Update Services (WSUS), which can help to determine whether vulnerabilities are being patched effectively by WSUS.
Microsoft provides a free, built-in Windows program called WSUS that allows organizations to configure and automatically deploy patches securely to Windows systems throughout the enterprise. In order to address which systems need to be patched, organizations must have an accurate and up-to-date asset management system in place. Organizations must also address stand-alone systems or hosts isolated from the main network that may not be a part of an enterprise-wide patch management solution. These systems not managed with WSUS can be easily overlooked by administrators, as scanning and patching these systems manually can leave potentially critical systems and data vulnerable to attack. By continuously testing, monitoring, and rescanning all systems to ensure patches have been applied correctly, organizations can help to keep Windows-based systems secure and up to date.
The WSUS Patch Management Overview dashboard provides a comprehensive look at Microsoft vulnerabilities detected by WSUS, as well as other patch management solutions and stand-alone systems. Components within this dashboard can be useful in comparing the effectiveness of existing WSUS patch management efforts and whether existing security controls need to be modified. Analysts can use this information to focus efforts on identifying both current and previously mitigated vulnerabilities. Using the results from active Nessus scans, analysts can easily compare vulnerability results against those reported by WSUS. This comparison of information can be useful in detecting hosts reporting potentially outdated or inaccurate data. Vulnerabilities detected by Nessus can be used to detect stand-alone systems not managed by WSUS, and aid in comparing the efficacy of patch management efforts. Events reported by Windows Update and WSUS can alert to service-related issues that should be reviewed further. Information on WSUS client systems can help analysts detect hosts that may not be reporting properly, or that are not managed by WSUS. Organizations can use this dashboard to proactively address and strengthen overall network security and patch management efforts across the network.
This dashboard is available in the Tenable.sc Feed, a comprehensive collection of dashboards, reports, Assurance Report Cards, and assets. The dashboard can be easily located in the Tenable.sc Feed under the category Discovery & Detection. The dashboard requirements are:
- Tenable.sc 5.4.0
- Nessus 8.6.0
- LCE 6.0.0
Tenable.sc Continuous View (CV) is the market-defining continuous network monitoring solution, and can assist in securing an organization’s internal network and effectively monitor patch management solutions. Tenable.sc CV is continuously updated with information about advanced threats, zero-day vulnerabilities, and new regulatory compliance data. Active scanning periodically examines systems to determine vulnerabilities and compliance concerns. Agent scanning enables scanning and detection of vulnerabilities on transient and isolated devices. Passive listening provides real-time discovery of vulnerabilities on operating systems, protocols, network services, wireless devices, web applications, and critical infrastructure. Host data and data from other security products is analyzed to monitor patch management solutions on the network. Tenable.sc CV provides an organization with the most comprehensive view of the network and the intelligence needed to support proactive patch management efforts.
The following components are included in this dashboard:
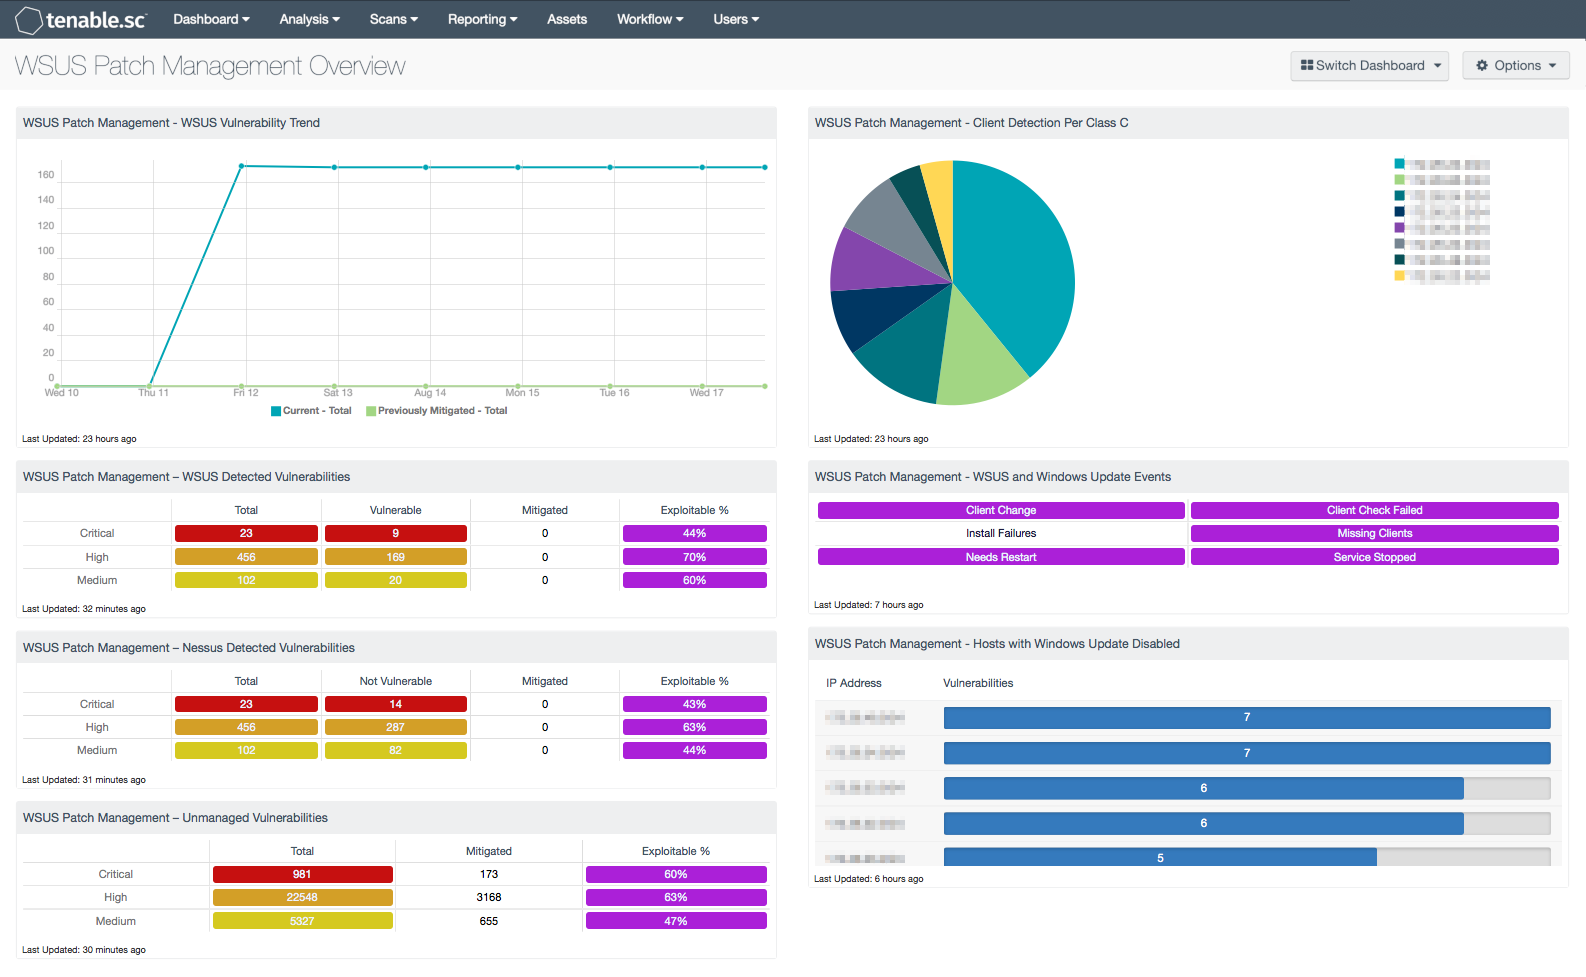
- WSUS Patch Management - WSUS Vulnerability Trend: This component presents a trend line chart of both current and previously mitigated vulnerabilities reported by WSUS over the last seven days. Information presented within this component can provide organizations with a comprehensive view into how often systems are being scanned, patched, and rescanned. Current vulnerabilities are identified and set to the “Never Mitigated” filter. When a vulnerability moves from the mitigated section to the active section, the mitigation status is set to “Previously Mitigated.” Previously mitigated or recurring vulnerabilities can be the result of systems not being restarted after a patch was applied, virtual systems reverting to previous snapshots, or services that were disabled or failed to restart. Organizations can use this component to focus efforts on remediating both current and previously mitigated vulnerabilities.
- WSUS Patch Management – WSUS Detected Vulnerabilities: This component provides a summary of Microsoft vulnerabilities detected by WSUS. Results from other patch management systems deployed on the network may also be included within the vulnerability results. Tenable supports a wide variety of patch management systems, which include SCCM, IBM BigFix, Symantec Altiris, and Dell KACE K1000. Each row is separated by severity level and includes vulnerabilities discovered within the Windows: Bulletin Plugin Family. Each column includes the total number of vulnerabilities discovered, number of vulnerabilities discovered by Nessus that WSUS is reporting as vulnerable, along with mitigated and exploitable vulnerabilities. Information presented within this component can be used to discover whether vulnerabilities are being patched by WSUS in a timely manner, along with hosts reporting outdated vulnerability information.
- WSUS Patch Management – Nessus Detected Vulnerabilities: This component provides a summary of Microsoft vulnerabilities detected by Nessus that have been reported as not vulnerable by WSUS. The rows are separated by severity level and includes vulnerabilities discovered within the Windows: Bulletin Plugin Family. Each column includes the total number of vulnerabilities discovered by WSUS, number of vulnerabilities discovered by Nessus that WSUS is reporting as not vulnerable, along with mitigated and exploitable vulnerabilities. Information presented within this component provides targeted information the analyst can use to identify how often systems are being patched by WSUS, and whether current security settings need to be modified.
- WSUS Patch Management – Unmanaged Vulnerabilities: This component provides a summary of vulnerabilities detected by Nessus on systems not managed by patch management systems. Each row is separated by severity level, and includes Microsoft vulnerabilities discovered within the Windows: Bulletin Plugin Family. Each column includes the total number of vulnerabilities discovered on unmanaged systems, along with mitigated, and exploitable vulnerabilities. This table provides targeted information analysts need to compare the effectiveness of WSUS patch management efforts, and whether current security settings need to be modified.
- WSUS Patch Management - Client Detection Per Class C: This chart presents a Class C summary of hosts managed by a WSUS server. Nessus actively scans the registry of each Windows host to determine whether Windows Update is enabled or disabled. Enabling an enterprise-wide patch management solution will assist the organization in protecting critical systems from compromise, and reducing overall risk. Organizations that have stand-alone or isolated hosts within the network should always be included in any patch management policy. Analysts can use this component to identify these types of hosts within the network that may not be fully patched or a part of a patch management solution.
- WSUS Patch Management – WSUS and Windows Update Events: This matrix assists the organization in monitoring both WSUS and Windows Update changes on its network. Each indicator is based on one or more LCE change events; the indicator is highlighted purple if the event occurred in the last 72 hours. Many of these indicators highlight Windows update changes, failures, repeated installation failures, hosts needing reboots, missing WSUS clients, and hosts with Windows Update service stopped. Any changes should be investigated further to determine the cause, and whether additional action is required by the analyst. Clicking on a highlighted indicator will bring up the analysis screen, which will display additional event details on Windows Update and WSUS events.
- WSUS Patch Management - Hosts with Windows Update Disabled: This component presents Class C summary of hosts with Windows Update service disabled. Nessus actively scans the registry of each Windows host to determine whether Windows Update is enabled or disabled. By default, systems not managed by a WSUS server may not have Windows Update enabled or configured properly. Having Windows Update disabled can leave critical systems at risk for compromise. Analysts can drill down and obtain additional information on hosts within each subnet to determine hosts that need to be patched, or if hosts are being managed by another third party patch management solution.