by Cody Dumont
Patch management is a key process of any risk management program. Operating system patch management is often built into the operating systems, but what about the other applications used in an organization? This dashboard helps monitor the patch management process for several different types of allocations.
Tenable.sc Continuous View (CV) has the ability to track new and mitigated vulnerabilities. When a host is scanned and a vulnerability is discovered for the first time, the Vulnerability Discovered date is set. When the host is scanned a subsequent time, and the vulnerability is no longer present, the vulnerability is considered mitigated. When a vulnerability is mitigated, the Vulnerability Mitigated date is set. Analysts can use the Days to Mitigate filter to track the amount of time taken to apply a patch.
The dashboard and its components are available in the Tenable.sc Feed, a comprehensive collection of dashboards, reports, assurance report cards and assets. The dashboard can be easily located in the Tenable.sc Feed under the category Threat Detection & Vulnerability Assessments.
The dashboard requirements are:
- Tenable.sc 4.8.1
- Nessus 8.5.0
- LCE 6.0.0
- NNM 5.9.0
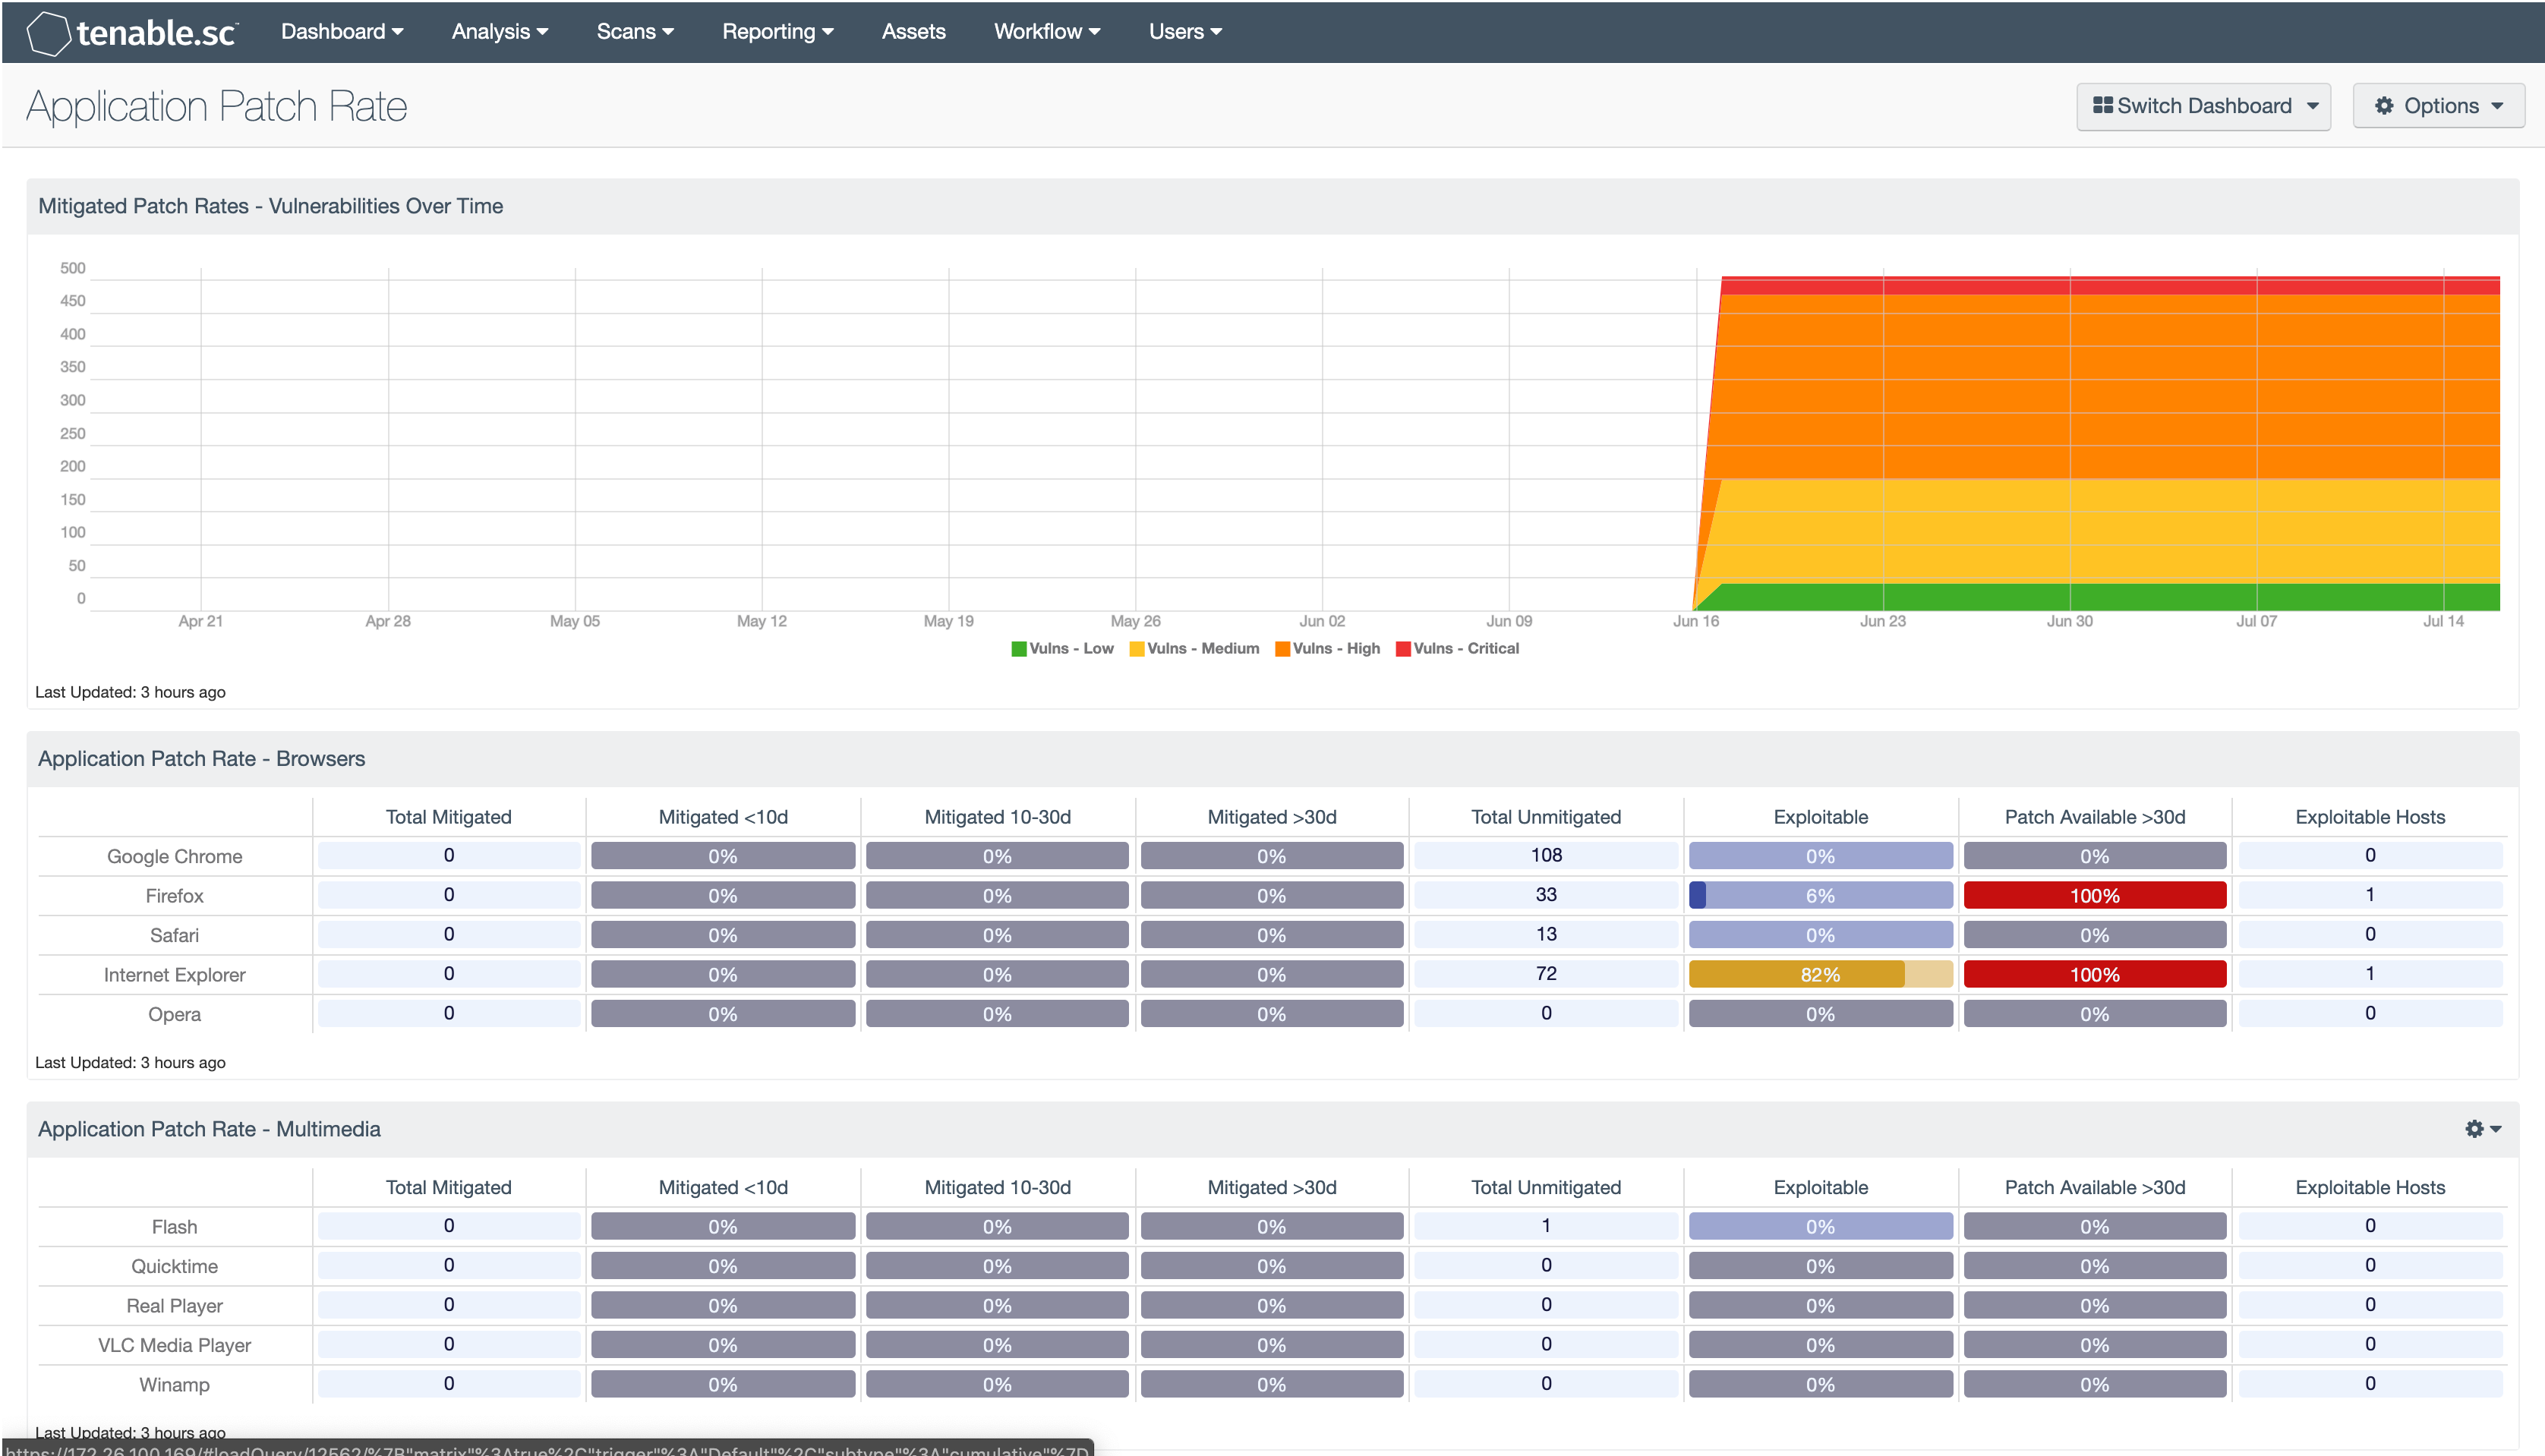
The components in this dashboard provide a view of how application patching is currently being handled by the organization. The data provided includes the patch rates, current vulnerabilities, and if the vulnerabilities can be patched and exploited. The matrix includes 8 rows: 4 report on the mitigation status and 4 report on the current vulnerability status.
The first 4 columns provide a high level view of patches that have been applied. The first column provides the total vulnerabilities patched. The second, third, and forth columns provide the percentage of vulnerabilities patched over the past 10 days, 10 to 30 days, and over 30 days respectively. The colors of the cells will change based on the percentage of patches applied. When 95% of vulnerabilities are mitigated the color will be blue. The color will be green for more than 75%, yellow for the more than 50%, orange for more than 25%, and red when less that 25% of the vulnerabilities are patched. The total of the 3 columns will total 100%. When the majority of patches applied is in the forth column, a serious review of the patch management system should be conducted, because patches are taking longer than 30 days to be applied.
The last 4 columns contain the current vulnerabilities. The fifth column provides the number of vulnerabilities currently discovered. The sixth column provides the percentage of vulnerabilities that are currently exploitable. The seventh column provides the number of exploitable vulnerabilities that have had patches released more than 30 days ago that have not yet been applied. The eighth column provides a current count of hosts with exploitable vulnerabilities.
Tenable.sc CV’s ability to scale vulnerability management allows the organization to identify the biggest risk across the entire enterprise. Providing a unique combination of detection, reporting and pattern recognition utilizing industry recognized algorithms and models. SC CV, Log Correlation Engine (LCE), Nessus Network Monitor (NNM), and Nessus are continuously updated with information about advanced threats and zero-day vulnerabilities, and new types of regulatory compliance configuration audits.
Mitigated Patch Rates - Vulnerabilities Over Time: This component is a 90 day summary chart tracking active vulnerabilities with low, medium, high, and critical severities.
Application Patch Rate - Browsers: Client side attacks are some of the most successfully executed attacks today. One of the biggest targets of client side attacks is web attacks through the Internet browser. Maintaining a patched browser is critical for a securing the desktop. This matrix provides a view of how patching browsers are currently being handled by the organization.
Application Patch Rate - Multimedia: Multimedia applications and frameworks are common attack vectors, as they parse large amounts of data. While parsing the large data files, they are often prone to buffer overflow or other file parsing attacks. This matrix provides a view of how patching multimedia software is currently being handled by the organization.
Application Patch Rate - Email Clients: Email clients are susceptible to client side attacks by attachments or by Multi-Purpose Internet Mail Extensions (MIME) embedded attacks. Other methods of exploitation are the supported authentication methods or protocols used to access email servers. This matrix provides a view of how patching email software is currently being handled by the organization.
Application Patch Rate - PDF Readers: The Portable Document Format (PDF) is a widely used file format used to share information across platforms and environments. The PDF file format is being constantly expanded and includes many embedded scripting features. A malicious author can easily exploit these scripting features, such as Java script. Keeping the corporate approved PDF readers up to date is critical for an effective security program. This matrix provides a view of how patching PDF readers are currently being handled by the organization.
Application Patch Rate - Document Editors: Corporations and home users need to be able to create new content; this is often done using a document editor such as Microsoft Word. There are several options, both commercial and open source. Document editor software often has the ability to add scripting called macros to documents. A malicious author can easily exploit a vulnerability found in a macro or could deliberately create malicious code in the macro to exploit a reader of the document. This matrix provides a view of how patching document editors are currently being handled by the organization.
Application Patch Rate - Network Analysis Tool: There are several different type of network analysis tools found on a corporate network. Some of these tools, such as a network sniffer, must parse large data files and can be prone to buffer overflow attacks. These applications can also use unsecure protocols such as SNMP for monitoring the network or transferring files. This matrix provides a view of how patching network analysis tools is currently being handled by the organization.
Tenable One
Request a demo
The world’s leading AI-powered exposure management platform.
Thank You
Thank you for your interest in Tenable One.
A representative will be in touch soon.
Form ID: 7469
Form Name: one-eval
Form Class: c-form form-panel__global-form c-form--mkto js-mkto-no-css js-form-hanging-label c-form--hide-comments
Form Wrapper ID: one-eval-form-wrapper
Confirmation Class: one-eval-confirmform-modal
Simulate Success