by Stephanie Dunn
June 20, 2016
Many organizations use monitoring tools and devices that do not provide accurate coverage or real-time information into potential or existing threats. A lack in network monitoring can limit an organization’s ability to effectively detect, respond, and recover from security incidents. The ISO/IEC27000 Continuous Monitoring dashboard provides real-time analysis from firewalls, IDS/IPS, and other security devices, which can detect network spikes, suspicious access attempts, and other malicious activity on a network.
The ISO/IEC 27002:2013 framework is a global security standard that provides best practice solutions in support of the controls found in Annex A of ISO/IEC 27001:2013. The framework establishes guidelines and general principles for initiating, implementing, maintaining, and improving Information Security Management Systems (ISMS). Each security control and objective provided within the standard can be tailored to specific business and regulatory objectives, and assist with maintaining overall compliance. This dashboard focuses on the ISO/IEC 27002 12.4 and 16.1.2 controls, which can help organizations to detect and respond effectively to potential intrusions.
In order for an organization to maintain business continuity, networks must be continuously monitored to combat potential threats. As organizations add additional devices and networks become more complex, organizations can easily lose sight of events. By monitoring both internal and external events, analysts will be able to easily detect and respond to suspicious events and network anomalies. This will allow organizations to improve incident response times, strengthen network security, and protect critical assets.
This dashboard provides a continuous, in-depth view of suspicious network activity, network spikes, potential attacks, and more. Tenable’s Log Correlation Engine (LCE) analyzes event log data from a variety of security and infrastructure devices within a network. LCE can gather and search logs from any application, or network device, which can provide real-time information on firewall activity, IDS/IPS events, and other security monitoring devices. Analysts can obtain real-time targeted events that can help to improve response times, and reduce impact from a potential event. Organizations that implement an effective continuous monitoring program will obtain a continuous and accurate assessment of overall network health, and improve its overall security posture.
The dashboard and its components are available in the Tenable.sc Feed, a comprehensive collection of dashboards, reports, assurance report cards and assets. The dashboard can be easily located in the Tenable.sc Feed under the category Compliance & Configuration Assessment. The dashboard requirements are:
- Tenable.sc 5.3.2
- Nessus 8.5.1
- LCE 6.0.0
- NNM 5.9.0
Tenable.sc Continuous View (CV) is the market-defining continuous network monitoring platform. Tenable’s Log Correlation Engine (LCE) performs automatic discovery of users, infrastructure, and vulnerabilities across more technologies than any other vendor including operating systems, network devices, hypervisors, databases, tablets, phones, web servers, and critical infrastructure. Nessus is continuously updated with information about advanced threats and zero-day vulnerabilities, and new types of regulatory compliance configuration audits. Tenable.sc CV’s proactive continuous monitoring identifies your biggest risk across the entire enterprise.
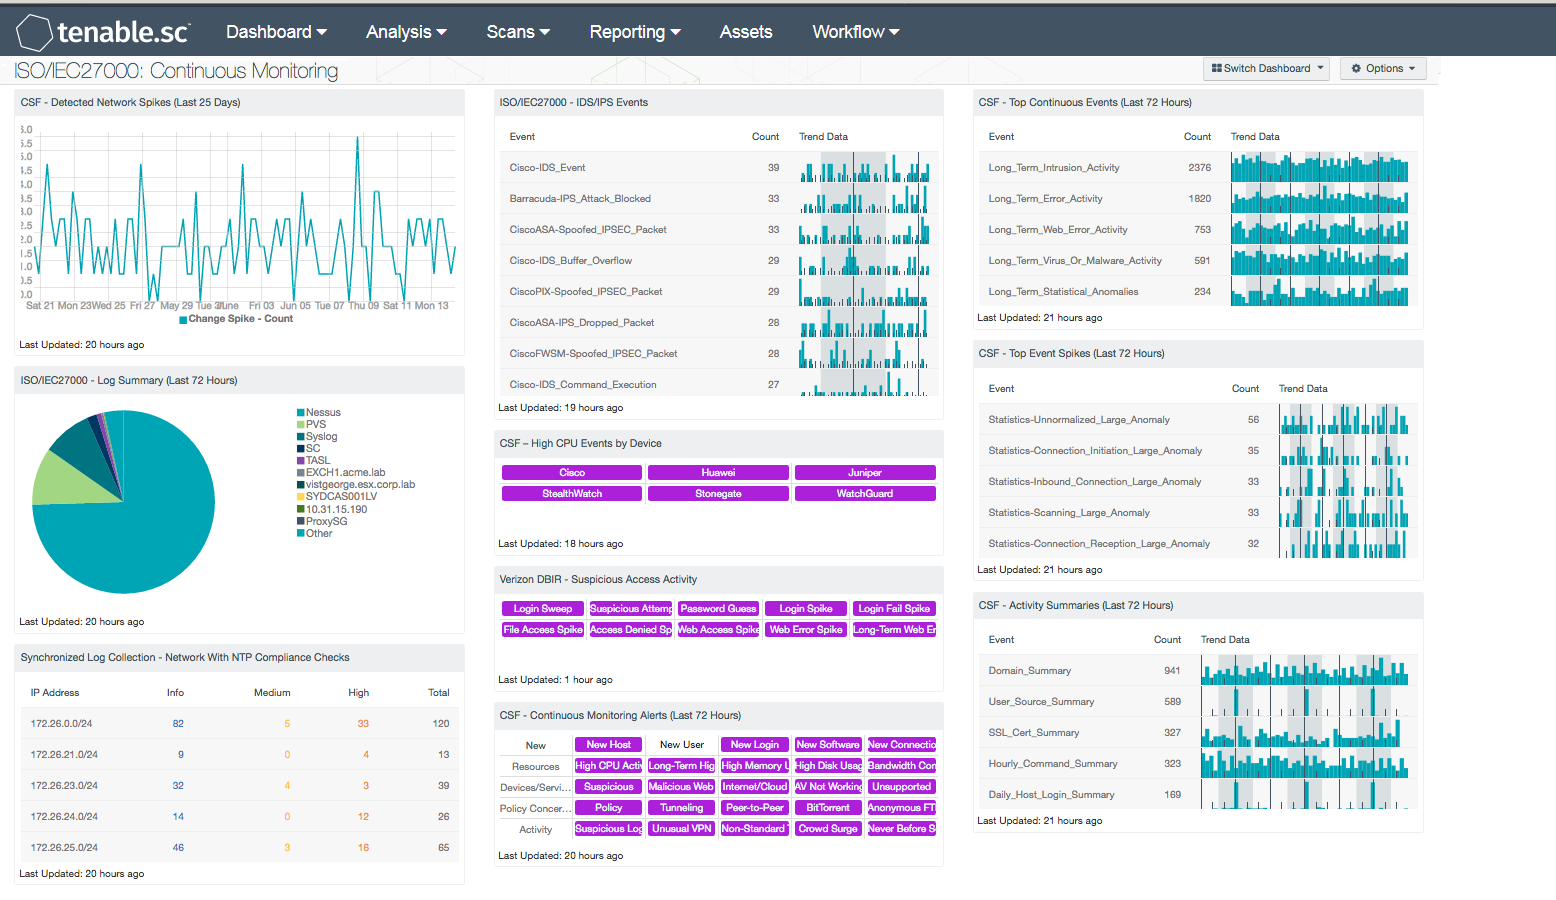
This dashboard contains the following components:
- CSF - Detected Network Spikes (Last 25 Days): This chart utilizes the ‘Statistics-Detected_Change_Large_Anomaly’ normalized event, which detects anomalous network spikes. The LCE stats daemon has found a detected-change type event spike. Events of this type are being sent to the LCE stats daemon, and are comparing this hour's event rate for each unique targeted IP address to the same hour in each previous day for the entire body of collected data. Any large changes in event rates can indicate new types of software installations, patching, or can indicate instances of malicious activity on the network.
- ISO/IEC27000 - Log Summary (Last 72 Hours): This component presents a chart of the top events from log sensors on a network over the last 72 hours. The log sources with the highest number of events are located at the top. Additionally, this component helps to ensure that systems that can send logs are sending them to LCE and/or allowing PVS to scan them. Logs are sent to LCE that will show correlated events across all network devices. The analyst can drill down to obtain additional information log sensors, and gain insight into network activity.
- Synchronized Log Collection - Network With NTP Compliance Checks: This component reports on audit checks that verify the NTP settings on subnets. Centralized and time-synchronized logging, and timely log analysis will increase an organization's ability to rapidly identify patterns of suspicious behavior and correlate logged events across multiple workstations and servers. This practice enables investigation and auditing functions to be easier and more effective should an intrusion occur.
- ISO/IEC27000 - IDS/IPS Events: This component presents normalized event information from IDS and IPS devices on a network. LCE summarizes this data into normalized events that are collected from IDS and IPS devices. The events are sorted with the highest number of events by count at the top. Analysts can use this component to target network devices that are reporting suspicious or malicious events. All events should be investigated further to determine potential risk to the organization.
- CSF - High CPU Events by Device: This component presents information on high CPU or high traffic based events on network devices. The matrix presents activity indicators for various network devices such as firewalls, routers, and other network devices over the last 72 hours. This component assumes that if log events were received from a particular device, then that device is active on the network. Once an event is detected, the indicator will turn purple. The analyst should review events to determine if further action is needed.
- Verizon 2015 DBIR - Suspicious Access Activity: This matrix assists the organization in monitoring for suspicious access activity such as suspicious login activity and spikes in file and web accesses. Each indicator is based on one or more LCE events; the indicator is highlighted purple if the event occurred in the last 72 hours. Login spikes can occur when an account is compromised and shared and used by many hackers. Login failure spikes may indicate brute-force password guessing. File access and access denied spikes may indicate suspicious access to files. Web access spikes may indicate a busier-than-normal web server or more Internet browsing. Web error spikes and long-term Web errors can identify web application scanning and web probes. Clicking on a highlighted indicator will bring up the analysis screen to display details on the events and allow further investigation.
- CSF - Continuous Monitoring Alerts (Last 72 Hours): This matrix assists the organization in monitoring changes on its network. Each indicator is based on one or more LCE change events; the indicator is highlighted purple if the event occurred in the last 72 hours. Many of these indicators highlight new additions to the network, such as new hosts, new software, and new open ports. Indicators are also included to highlight firewall and router changes. Any new additions or changes should be investigated to determine if they are authorized. The Change Spike indicator is highlighted if a large number of changes were detected compared to previous change event rates. The File Integrity Spike indicator is highlighted if a large number of file change events were detected. Clicking on a highlighted indicator will bring up the analysis screen to display details on the change events and allow further investigation.
- CSF - Top Continuous Events (Last 72 Hours): This table displays the top continuous, or long-term, events detected on the network in the last 72 hours. The table is sorted so that the continuous events detected most often are at the top. Detecting events that occur without stopping for long periods of time is a core form of correlation performed by the LCE. The LCE can identify hosts that are generating specific event types for periods of 20 minutes or longer. This table can be used by an analyst to investigate recent continuous network activity and determine if it may indicate network problems. Clicking on the Browse Component Data icon will bring up the event analysis screen to display all of the continuous events and allow further investigation. In the analysis screen, clicking on a particular event will display all occurrences of that event. Setting the tool to IP Summary will display the systems on which the events occurred. Setting the tool to Raw Syslog will display the raw syslog of the events, which can give more details.
- CSF - Top Event Spikes (Last 72 Hours): This table displays the top large event anomalies, or spikes, detected on the network in the last 72 hours. The table is sorted so that the anomalies detected most often are at the top. Statistical anomaly detection is a core form of correlation for the LCE. The intent is to automatically learn baselines for event occurrences and identify deviations. For each host on the network, the LCE compares the count of events for that hour to the same hour on previous days over the lifetime of behavior for the host. When there is a statistically significant deviation, the LCE generates an anomaly event. This table can be used by an analyst to investigate recent large anomalies in network activity and determine if they may indicate network problems. Clicking on the Browse Component Data icon will bring up the event analysis screen to display all of the large anomaly events and allow further investigation. Clicking on a particular event will display all occurrences of that event. Setting the tool to IP Summary will display the systems on which the events occurred. Setting the tool to Raw Syslog will display the raw syslog of the events, which can give more details.
- CSF - Activity Summaries (Last 72 Hours): This table displays all summary events generated by the LCE in the last 72 hours. The LCE maintains summaries of the various event information it receives and periodically creates summary logs, such as summaries of visited Internet domains, hourly summaries of commands issued on hosts, and daily summaries of users active on hosts. This table can be used by an analyst to investigate recent network activity of interest. Clicking on the Browse Component Data icon will bring up the event analysis screen to display the summary events and allow further investigation. In the analysis screen, clicking on a particular event will display all occurrences of that event. Setting the tool to Raw Syslog will display the raw syslog of the events, which can give more details.