by David Schwalenberg
February 26, 2016
How do you know what's happening on your network? Today's enterprise networks are constantly changing. Just scanning the network for vulnerabilities every quarter or even every month does not provide enough information to know what mobile devices are interacting with the network, how the network might be being attacked, what network activity changes might be occurring, etc. Continuous network monitoring can provide all that information and more.
Continuous network monitoring helps an organization maintain ongoing awareness of its networks and security. Detection and correlation is performed automatically in order to present the most up-to-date and actionable information to analysts and network security personnel. Tenable.sc Continuous View (CV) is especially suited for this task, as it not only includes active vulnerability scanning with Nessus, but also passive monitoring with the Passive Vulnerability Scanner (PVS) and log correlation with the Log Correlation Engine (LCE).
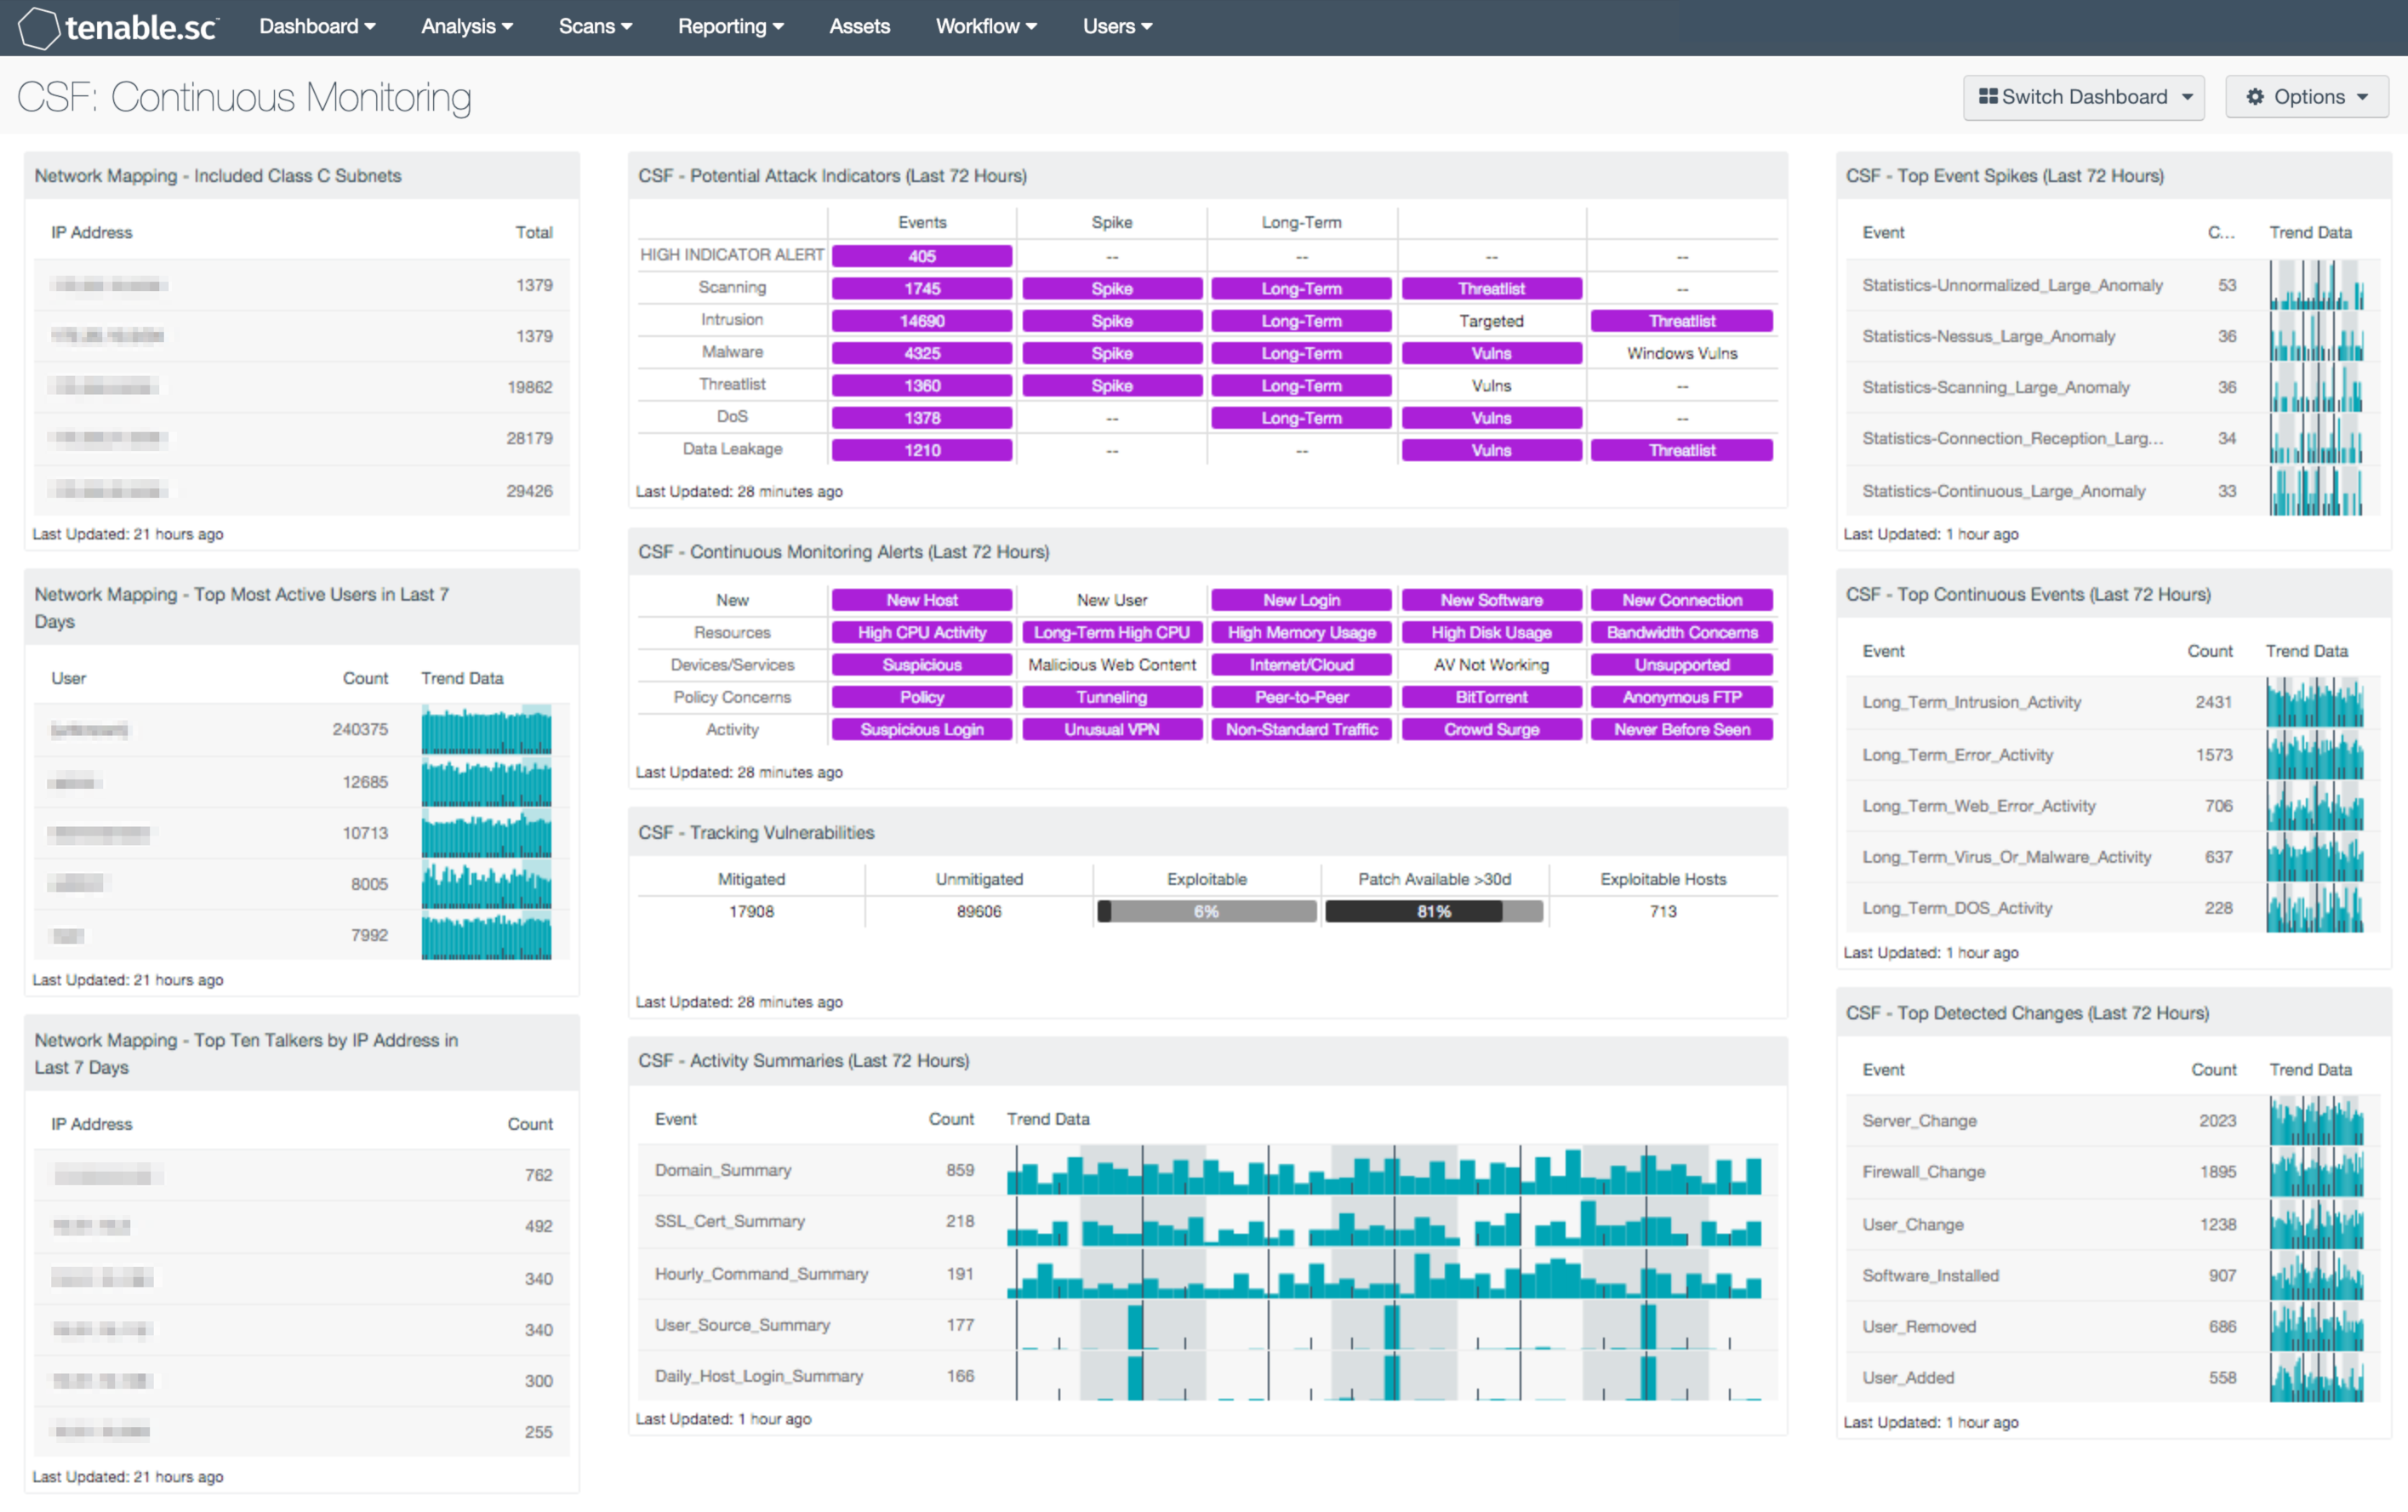
This dashboard provides a continuous monitoring overview. Alert indicators provide a quick visual of potential network attack activity, high resource usage, vulnerability mitigation progress, and more. Analysts will want to (and can easily) drill down into the data presented by the dashboard components in order to further investigate noted events, vulnerabilities, and trends. This dashboard can assist an organization in continuously monitoring its network and improving its network awareness and security.
The NIST Cybersecurity Framework (CSF) provides guidance based on existing standards, guidelines, and practices, which can be tailored to specific organizational needs. This dashboard aligns with the multiple CSF subcategories that deal with continuous monitoring, anomaly detection, and log correlation and analysis: ID.RA-3, PR.PT-1, DE.AE-1, DE.AE-2, DE.AE-3, DE.AE-4, DE.CM-1, DE.CM-3, DE.CM-7, RS.AN-1, RS.AN-3.
This dashboard and its components are available in the Tenable.sc Feed, a comprehensive collection of dashboards, reports, Assurance Report Cards, and assets. The dashboard can be easily located in the Tenable.sc Feed under the category Compliance & Configuration Assessment. The dashboard requirements are:
- Tenable.sc 5.2.0
- Nessus 8.5.0
- NNM 5.9.0
- LCE 6.0.0
Many other dashboards are available in the Discovery & Detection and Monitoring feed categories. These dashboards can assist in the continuous monitoring of the network. Some suggested dashboards are Detect Suspicious Activity, Indicators, NetFlow Monitor, Passive Network Forensics, Targeted Event Monitoring, and Verizon 2015 DBIR - Incident Pattern Monitoring. For more information on the event correlation techniques used by Tenable’s Log Correlation Engine (LCE) to detect abuse, anomalies, compromise, and compliance violations, see the Tenable Event Correlation whitepaper.
Tenable.sc Continuous View (CV) is the market-defining continuous network monitoring solution. Tenable.sc CV includes active vulnerability detection with Nessus and passive vulnerability detection with Tenable’s Nessus Network Monitor (NNM), as well as log correlation with Tenable’s Log Correlation Engine (LCE). Using Tenable.sc CV, an organization will obtain the most comprehensive and integrated view of its network.
The following components are included in this dashboard:
- Network Mapping - Included Class C Subnets: This table assists an organization in understanding the scope of its network by grouping all the IP addresses discovered actively by Nessus, passively by PVS, and from log events recorded by LCE into representative Class C subnets. This information can assist an organization in detecting any unauthorized subnets or rogue devices. Note that if the organization has a very large network, this component can be modified to present Class B subnets, if desired. The Total column displays the number of detections. This number of detections may be greater than the number of hosts in each subnet, as each host may have been detected multiple times.
- Network Mapping - Top Most Active Users in Last 7 Days:This table presents the most active users on the network in the last seven days based on the number of network user events generated. The table is sorted so that the user with the highest count of events is at the top. Trend lines of events per user over the last seven days are included. This information can assist an organization in tracking normal activity, as well as discovering any unusual activity. Note that the number of users that the table displays can be adjusted in the component based on the size of the organization, and should typically be 10-15% of the total users on the network.
- Network Mapping - Top Ten Talkers by IP Address in Last 7 Days: This table presents host information for the top ten most active systems on the network in the last seven days based on the number of network traffic events generated. LCE records network traffic events from the Tenable Network Monitor and the Tenable NetFlow Monitor; the most active hosts will have the highest counts of these events. The table is sorted so that the system with the highest count of events is at the top. This information can assist an organization in tracking normal activity, as well as discovering any unusual activity. Editing the filters in the component and changing the tool from IP Summary to Class C Summary, Asset Summary, or Port Summary can give information on the top most active subnets, assets, or ports, respectively. Editing the filters in the component and changing the tool from IP Summary to Class C Summary, Asset Summary, or Port Summary can give information on the top most active subnets, assets, or ports, respectively.
- CSF - Potential Attack Indicators (Last 72 Hours): This matrix displays alerts for network activity over the last 72 hours that may indicate attacks against the network. This activity includes scanning events, intrusion events, malware events, threatlist events (interactions with known bad IP addresses), denial of service events, and data leakage events. Each row displays the number of events and may also show alerts for spikes in the number of events, events that have occurred continuously for a long time, associated vulnerabilities, and other information. Targeted Intrusions are intrusions that can be correlated with current network vulnerabilities, and so represent attacks that are likely to succeed. High Indicator Alert events indicate that a suspicious sequence of ten or more events occurred. Clicking on a highlighted indicator will bring up the analysis screen to display details on the detections and events and allow further investigation. In the analysis screen, setting the tool to IP Summary will display the systems on which the detections and events occurred. For event detections, setting the tool to Raw Syslog will display the raw syslog of the events, which can give more details. For vulnerabilities, setting the tool to Vulnerability Detail List will display the full details for each vulnerability, including a description, the solution to fix the vulnerability, and in some cases, links to more information.
- CSF - Continuous Monitoring Alerts (Last 72 Hours): This matrix displays alerts for network activity over the last 72 hours that may be suspicious or of interest. Types of activity are grouped by row, and include new devices, users, software, etc., high resource usage, suspicious devices, use of Internet or cloud services, potential policy concerns, anonymous FTP detection, suspicious or never before seen activity, and more. Clicking on a highlighted indicator will bring up the analysis screen to display details on the detections and events and allow further investigation. In the analysis screen, setting the tool to IP Summary will display the systems on which the detections and events occurred. For event detections, setting the tool to Raw Syslog will display the raw syslog of the events, which can give more details. For vulnerabilities, setting the tool to Vulnerability Detail List will display the full details for each vulnerability, including a description, the solution to fix the vulnerability, and in some cases, links to more information.
- CSF - Tracking Vulnerabilities: This matrix assists in tracking actively and passively discovered vulnerabilities by displaying total mitigated vulnerabilities, total unmitigated vulnerabilities, the percent of unmitigated vulnerabilities that are exploitable, and the percent of unmitigated, exploitable vulnerabilities that have had a patch available for more than 30 days. Ideally, this last percentage should be 0% because all vulnerabilities with patches available should have been mitigated already. Also displayed are the number of hosts on the network that have exploitable vulnerabilities. Note that because compliance failures are tracked as vulnerabilities, they will be included in the unmitigated vulnerabilities column. Clicking on a highlighted indicator will bring up the vulnerability analysis screen to allow further investigation. In the analysis screen, setting the tool to IP Summary will display the systems on which the vulnerabilities are present. Setting the tool to Vulnerability Detail List will display the full details for each vulnerability, including a description, the solution to fix the vulnerability, and in some cases, links to more information.
- CSF - Activity Summaries (Last 72 Hours): This table displays all summary events generated by the LCE in the last 72 hours. The LCE maintains summaries of the various event information it receives and periodically creates summary logs, such as summaries of visited Internet domains, hourly summaries of commands issued on hosts, and daily summaries of users active on hosts. This table can be used by an analyst to investigate recent network activity of interest. Clicking on the Browse Component Data icon will bring up the event analysis screen to display the summary events and allow further investigation. In the analysis screen, clicking on a particular event will display all occurrences of that event. Setting the tool to Raw Syslog will display the raw syslog of the events, which can give more details.
- CSF - Top Event Spikes (Last 72 Hours): This table displays the top large event anomalies, or spikes, detected on the network in the last 72 hours. The table is sorted so that the anomalies detected most often are at the top. Statistical anomaly detection is a core form of correlation for the LCE. The intent is to automatically learn baselines for event occurrences and identify deviations. For each host on the network, the LCE compares the count of events for that hour to the same hour on previous days over the lifetime of behavior for the host. When there is a statistically significant deviation, the LCE generates an anomaly event. This table can be used by an analyst to investigate recent large anomalies in network activity and determine if they may indicate network problems. Clicking on the Browse Component Data icon will bring up the event analysis screen to display all of the large anomaly events and allow further investigation. Clicking on a particular event will display all occurrences of that event. Setting the tool to IP Summary will display the systems on which the events occurred. Setting the tool to Raw Syslog will display the raw syslog of the events, which can give more details.
- CSF - Top Continuous Events (Last 72 Hours): This table displays the top continuous, or long-term, events detected on the network in the last 72 hours. The table is sorted so that the continuous events detected most often are at the top. Detecting events that occur without stopping for long periods of time is a core form of correlation performed by the LCE. The LCE can identify hosts that are generating specific event types for periods of 20 minutes or longer. This table can be used by an analyst to investigate recent continuous network activity and determine if it may indicate network problems. Clicking on the Browse Component Data icon will bring up the event analysis screen to display all of the continuous events and allow further investigation. In the analysis screen, clicking on a particular event will display all occurrences of that event. Setting the tool to IP Summary will display the systems on which the events occurred. Setting the tool to Raw Syslog will display the raw syslog of the events, which can give more details.
- CSF - Top Detected Changes (Last 72 Hours): This table displays the top change events detected on the network in the last 72 hours. The table is sorted so that the changes detected most often are at the top. This table can be used by an analyst to investigate recent network changes and determine if they are appropriate and authorized. Clicking on the Browse Component Data icon will bring up the event analysis screen to display all of the detected change events and allow further investigation. In the analysis screen, clicking on a particular event will display all occurrences of that event. Setting the tool to IP Summary will display the systems on which the events occurred. Setting the tool to Raw Syslog will display the raw syslog of the events, which can give more details.